Clicca "Examples" per svariati esempi. Puoi andare indietro (<) e avanti (>) per rivedere calcoli prcedenti. Puoi aprire WolframAlpha in più finestre. Puoi copiare le uscite "testo" cliccando "A Plain Text". Puoi salvare i grafici sul computer cliccando "@ Customize".
Click "Examples" for several examples. You can go back (<) and forward (>) to review previous calculations. You can open WolframAlpha in multiple windows. You can copy "text" outputs by clicking "A Plain Text". You can save the charts to your computer by clicking "@ Customize".
Examples:
days/hours || euro || 120-45-30 || digits || 7 → 12 || division-1 || simplify || points || distance || line segment || bisector || intervals || × table || + + || division-2 || approximations || cuboid || complementary || angle-1 || terms || trees || unknown || f(...) || bisection || round/fraction/... || number line || rational/real || for || relative difference || order || median/mean/mode || dot plot || geo. mean || quartiles || JS || translate || Morse || pie/bar/% || stem leaf || histogram-1 || terms/numerals/babylonian || clock || now || connective || polyominos || triangles/quadrilaterals || 3 figures || minmax || inequalities-1 || line/slope || complete square || solve-1/distribute || family of curves || monometric || mouse || handwrite || inequalities-2 || operations on sequences || function+constants || intersect graphs || inverse funct. || set/subsets || °C°F || circles || ball || Image || polyline || histogram-2 || polygon || angle-2 || repeating decimal || number-1 || Population || Technique/tecnology || History || Geography || Weather || calendar || colors || keep-fit || Food || Biology || SI-prefix || conversions || Chemistry || code || Music || Words || RPN || CAPTCHA || personages || artworks || inventors || didactics || circle/triangle || regular polygons || divisors || factor || multiples || integers || primes || number-2 || growth curve || probability || random-1 || histogram-3 || subset/ ! /permutation || cont.fraction || solve-2 || circle/curve/line || intercepts || corners || domain || Attention! || plot seq. || || centroid || geom.transform. || area param.curve || some curves || packing || Penrose || Escher || paradox || simplify/factor/… || lin.system || system || sequences/series/recursion || range of fun. || tab. function || limit || integral || piecewise || area || derivative || Σ ∏ || plot param/diseq || solve for real || prob. on integer || Physics-1 || vector || 3D-1 || spherical coord || 3D-2 || parabola || conics || fractals || tangent/normal || extrema/stationary || asymptotes || curvature || arc length || polar coord || cusps || interpolation / fit || min/max slope || statistics/quartile/boxplot/… || st.deviation || confidence interv || regres./ test || distributions-1 || random-2 || Cbin || cards || distributions-2 || linear indip || matrix || maxi/minimize || amortization || Taylor || power series || Fourier series || Hessian || rot/div/grad || plot z=Fxy || 3D-3 || trigo || cone || truncated cylinder || revolution || perspective || Physics-2 || rot/jacobi || differ.equ || double integral || complex n. || solve for complex || conchoid/klein/batman || Archimedean solids || NP || Mathematics || keyboard || resize
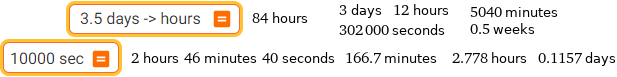
3.5 days -> hours | 10000 sec

minimal coin form 26.85 euros

1 euro | image euro
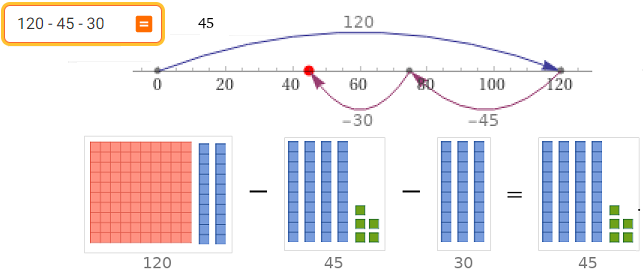
120 - 45 - 30 see also/vedi anche see also/vedi anche
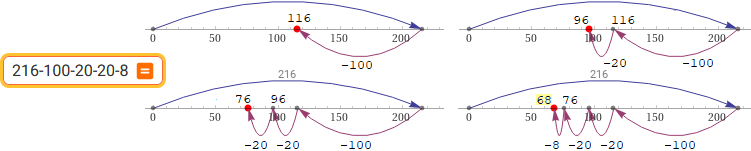
Visualizzare come risolvere un problema di sottrazione con l'aiuto della linea dei numeri: "Il cinema Star ha 216 posti. 148 persone sono già occupati. Quanti posti sono ancora liberi?" | Visualization of how to solve a subtraction problem with the help of the number line: "The Star cinema has a total of 216 seats and 148 persons are already sitting there. How many seats are stll free?"
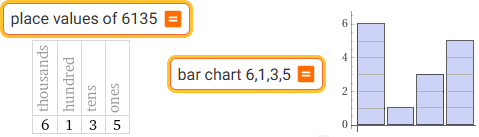 | places values of 6135 | bar chart 6,1,3,5 |
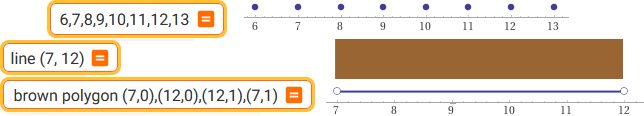
6,7,8,9,10,11,12,13 | line (7, 12) | brown polygon (7,0),(12,0),(12,1),(7,1)
(A bar of chocolate ranges from 7cm to 12cm. 7 to 12: 1, 2, ..., 6. Is the bar 6 cm long?)

12-7 | a=15, b=7, c=2, a-b*c
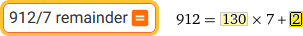 | 912/7 remainder |
 | simplify 102/360 | simplify sqrt(x^2) if x < 0 |
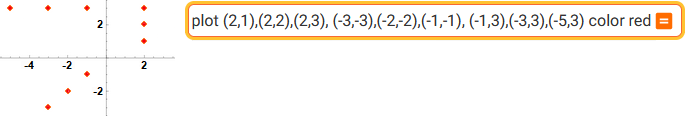
plot (2,1),(2,2),(2,3), (-3,-3),(-2,-2),(-1,-1), (-1,3),(-3,3),(-5,3) color red
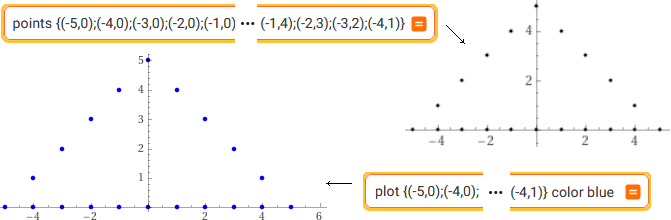
points {(-5,0);(-4,0);(-3,0);(-2,0);(-1,0);(0,0);(1,0);(2,0);(3,0);(4,0);(5,0);(4,1);(3,2);(2,3);(1,4);(0,5);(-1,4);(-2,3);(-3,2);(-4,1)}
plot {(-5,0);(-4,0);(-3,0);(-2,0);(-1,0);(0,0);(1,0);(2,0);(3,0);(4,0);(5,0);(4,1);(3,2);(2,3);(1,4);(0,5);(-1,4);(-2,3);(-3,2);(-4,1)} color blue
With "points" a monometric scale is used Con "points" viene usata una scala monometrica
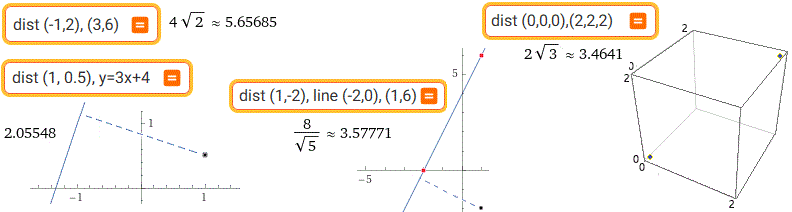
dist (-1,2), (3,6) | dist (0,0,0), (2,2,2) | dist (1, 0.5), y=3x+4 | dist (1,-2), line (-2,0),(1,6)

line segment (0,4), (2,0), line segment (2,0),(8,2), line segment (8,2),(0,4)
Posso disegnare solo 3 figure con comandi esepliciti; ma con una descrizione algebrica non ho questi limiti: vedi
I can only draw 3 figures with explicit commands; but with an algebraic description I don't have these limits: see

line segment(0,0),(cos 6°,sin 6°), line segment(0,0),(cos 98°,sin 98°), line segment(0,0),(cos(((6+98)/2)°),sin(((6+98)/2)°))
bisettrice / bisector

 | L'asse del segmento di estremi (1,3),(-2,-3) The perpendicular bisector of the line segment with endpoints (1,3),(-2,-3) punto medio di [midpoint of] (a,b), (p,q): (u,v) u =(a+p)/2, v = (b+q)/2 segment line (a,b),(c,d), line (u+(b-q), v+(p-a)),(u-(b-q), v-(p-a)) |
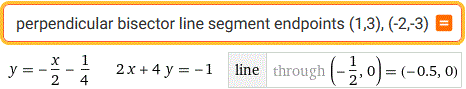
perpendicular bisector line segment endpoints (1,3), (-2,-3)

a = 1, b = 3, p = -2, q = -3, u = (a+p)/2, v = (b+q)/2

interval (0, 4), (2, 6], [4, 11]
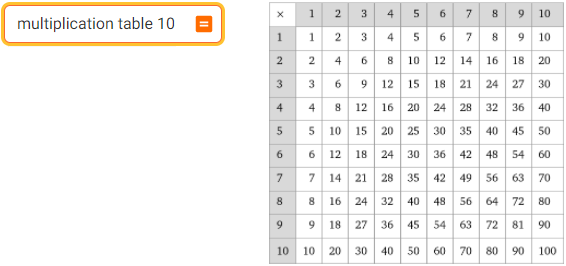
multiplication table 10

from 0 to 90 by 7
Quali sono 3 numeri naturali il cui prodotto sia 84? / What are 3 natural numbers whose product is 84?
 m*n*p = 84, m >= n >= p >= 0
m = 7, n = 4, p = 3 – m = 7, n = 6, p = 2 – m = 12, n = 7, p = 1 – m = 14, n = 3, p = 2 – m = 14, n = 6, p = 1
m = 21, n = 2, p = 2 – m = 21, n = 4, p = 1 – m = 28, n = 3, p = 1 – m = 42, n = 2, p = 1 – m = 84, n = 1, p = 1
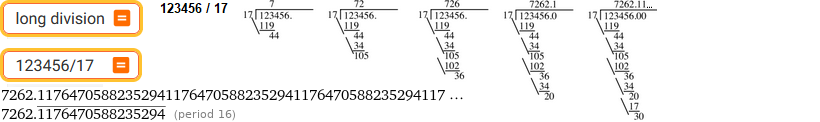
long division see also/vedi anche see also/vedi anche


floor( 123456/17, 100 ) | round( 123456/17, 100 ) | round( 123456/17, 0.01 )

round(5138 / 12746 * 100, 0.01) %
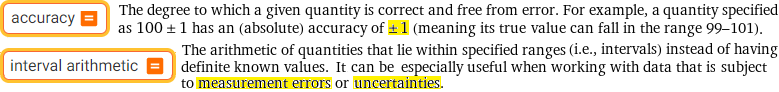
accuracy | interval arithmetic vedi/see, vedi/see or:

A car, traveling at constant speed, covers 240±2 m in 12±0.2 s. What is its speed? 20 ± 0.5 m/s
minmax x/y if( abs(x-240)<2, abs(y-12)<0.2)
I need to perform the following calculation with rounded values: 13.7 · 0.096 / 2.45 [0.531, 0.543] = 0.537 ± 0.006
minmax x*y/z if (abs(x-13.7)<0.05, abs(y-0.096)<0.0005, abs(z-2.45)<0.005)
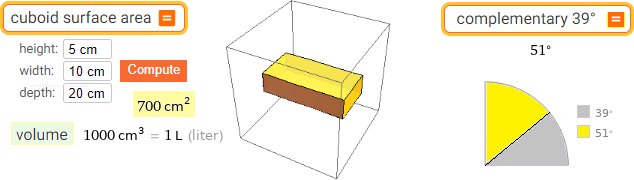
cuboid surface area | complementary 39° (rectangular cuboid = parallelepipedo rettangolo)
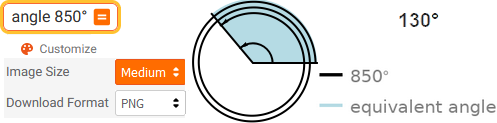
angle 850 °

(0.333...) * 2 + 4/3 + 2.5 | (sqrt(20)+sqrt(80))/(2*sqrt(15))

8/(6-2)*(2/3)/4-(3/2/(2*5)+6) | 8/(6-2)*(2/3)/4-(3+2/(2*5)+6)
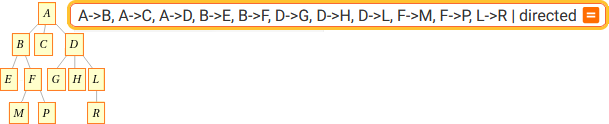 | Trees to represent the structure of terms: vedi/see |
| A->B, A->C, A->D, B->E, B->F, D->G, D->H, D->L, F->M, F->P, L->R | directed |


(5+?)*8 = 100
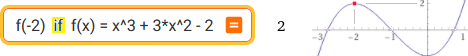
f(-2) if f(x) = x^3 + 3*x^2 - 2

x^3 + 3*x^2 - 2 if x = -3, -2, -1, 0, 1, 2, 3 or:
f( {-3, -2, -1, 0, 1, 2, 3} ) if f(x) = x^3 + 3*x^2 - 2
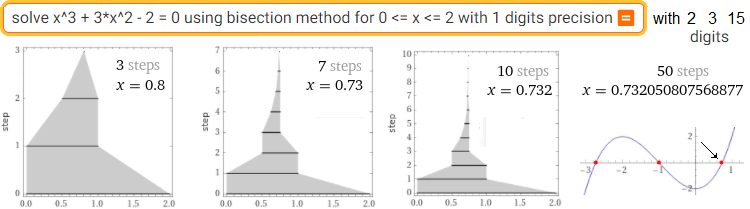
solve x^3 + 3*x^2 - 2 = 0 using bisection method for 0 <= x <= 2 with 1 digits precision
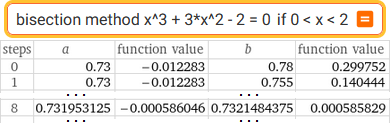 | bisection method x^3 + 3*x^2 - 2 = 0 if 0 < x < 2 |

sqrt(300)+sqrt(500), 12 digits | sqrt(300)+sqrt(500), 13 digits | round( sqrt(300)+sqrt(500), 0.1)
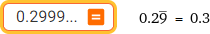 | 0.2999... |
 | 3/8 -> % |  | tape diagram 3/8 diagramma a nastro |
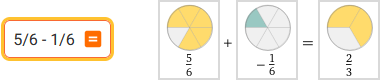 | 5/6 -1/6 |


7/8 | mixed fraction 12.6 | 66.66...%
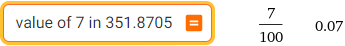
value of 7 in 351.8705

number line 0, sqrt(2), pi, 5

integer ^ (positive integer)
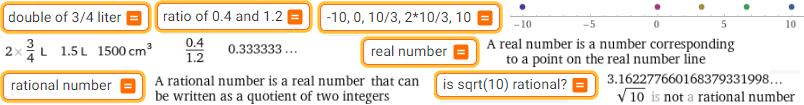
double of 3/4 liter | ratio of 0.4 and 1.2| -10, 0, 10/3, 2*10/3,10 | rational number | is sqrt(10) rational?
vedi/see vedi/see
An irrational number is a non-rational number, it is not a number whose digits follow each other without rules. Two examples:
0.10100001000000000100000000000000001...
0.202002000200002000002000000200000002...
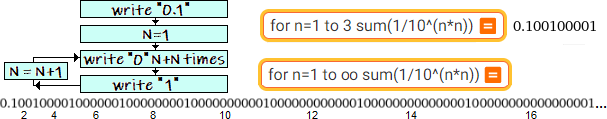
for n=1 to 3 sum(1/10^(n*n)) | for n=1 to oo sum(1/10^(n*n))

for n=1 to oo sum(2/10^(n*(n+1)/2))

relative difference

75/100, 2/3, 3/4, 7/10, 5/8 | sort 75/100, 2/3, 3/4, 7/10, 5/8
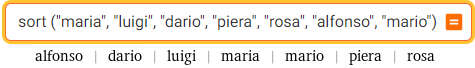
sort("maria","luigi","dario","piera","rosa","alfonso","mario")
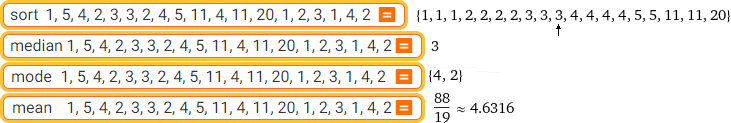
sort | median | mode | mean 1,5,4,2,3,3,2,4,5,11,4,11,20,1,2,3,1,4,2
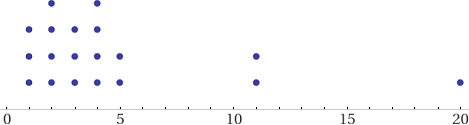 | dot plot {1,5,4,2,3,3,2,4,5,11,4,11,20,1,2,3,1,4,2} |
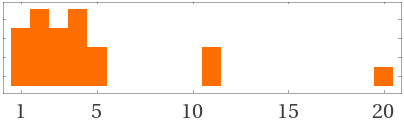
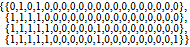
{{0,1,0,1,0,0,0,0,0,0,0,0,0,0,0,0,0,0,0,0}, {1,1,1,1,0,0,0,0,0,0,0,0,0,0,0,0,0,0,0,0}, {1,1,1,1,1,0,0,0,0,0,1,0,0,0,0,0,0,0,0,0}, {1,1,1,1,1,0,0,0,0,0,1,0,0,0,0,0,0,0,0,1}}
a block diagram / un diagramma a barre
  | Posso usare anche semplici script I can use simple scripts too vedi /see |

geometric mean | geometric mean 89/100, 70/100, 51/100
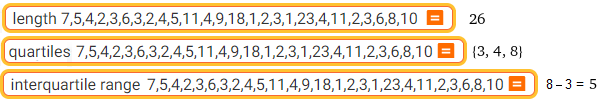
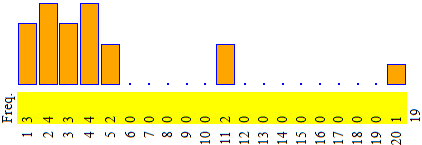
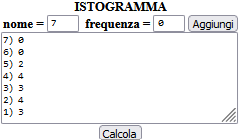
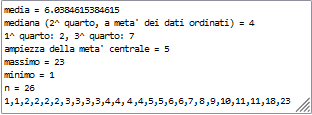
1,1,2,2,2,2, 3 ,3,3,3,4,4, 4 ,4,5,5,6,6,7, 8 ,9,10,11,11,18,23
| length | quartiles | interquartile range For large amounts of data vedi/see → |
 |
 vedi/see
translate chart from English to Italian | translate grafico from Italian to English

compare italiano, english


Morse code MACOSA
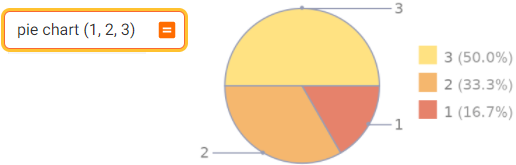
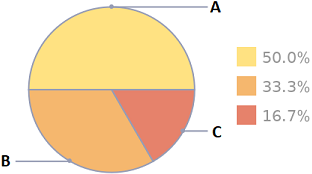
pie chart(1,2,3) or pie chart 1,2,3
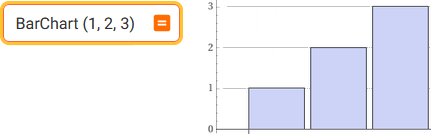
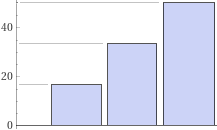
Bar Chart(1,2,3) or bar chart 1,2,3
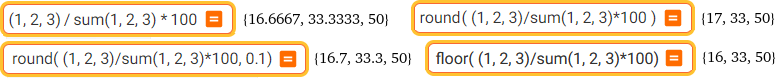
floor( (1, 2, 3)/sum(1, 2, 3)*100) | round( (1, 2, 3)/sum(1, 2, 3)*100, 0.1)
Bar Chart(1/6*100, 2/6*100, 3/6*100) / Bar Chart(16.6667, 33.3333, 50)
 |
1000*(1+20%)*(1+10%) 20% increase + 10% increase = 32% increase |
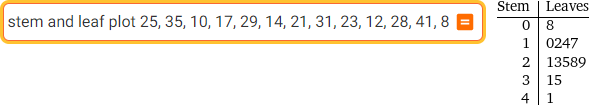
stem and leaf plot 25,35,10,17,29,14,21,31,23,12,28,41,8 or:
staistics 25,35,10,17,29,14,21,31,23,12,28,41,8 (click "more" if necessary)
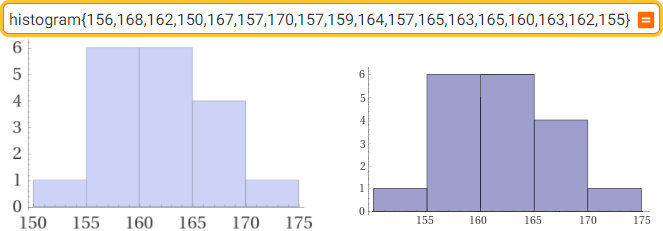
histogram{156,168,162,150,167,157,170,157,159,164,157,165,163,165,160,163,162,155}
histogram [{156,168,162,150,167,157,170,157,159,164,157,165,163,165,160,163,162,155},1]
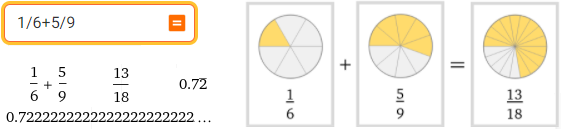
1/6+5/9
È scritto anche in notazione egiziana / also in Egyptian notation: 1/2 + 1/5 + 1/45 vedi/see
convert 1,2,3,4,5 to roman numerals | convert ... to babylonian numerals | ... mayan numerals | ... greek numerals

convert 1752 to Babylonian
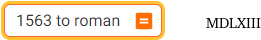
1563 to roman

(1 - 4/3 + 2/5) / (3/2 - 4/5 + 1/6)

19:32:55

this month | now
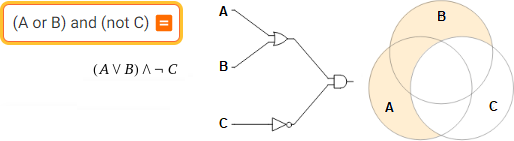
(A or B) and (not C)
 | polyomino |
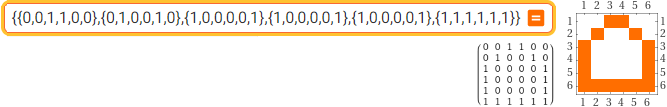
{{0,0,1,1,0,0},{0,1,0,0,1,0},{1,0,0,0,0,1},{1,0,0,0,0,1},{1,0,0,0,0,1},{1,1,1,1,1,1}}
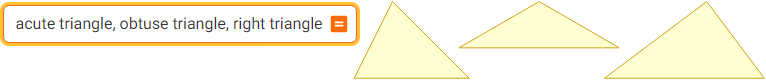
acute triangle, obtuse triangle, right triangle

7, 2, 8 triangle (angles are in rad; if you clik 0.918336 rad you have 52.62°) vedi/see tri ...

triangle side 33, angle 12, angle 90
or SSS 7 8 9 SAA 33 12deg 90deg
A long road is inclined at (6.5±0.25)°. If I walk 240 m how much will I rise?
Una lunga strada è inclinata di (6.5±0.25)°. Se cammino per 240 m di quanto mi innalzo?
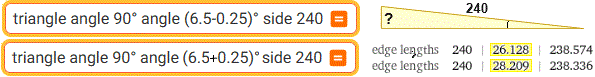
27.2 ± 1.1 m (≈ 27 ± 1 m)
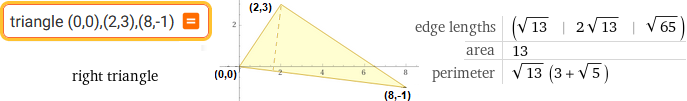
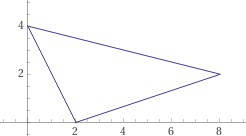
triangle (0,0),(2,3),(8,-1) or polygon (0,0),(2,3),(8,-1)

distance from (2,3) to line (0,0),(8,-1)

parallelogram side lengths 3,4 angle 30 degrees
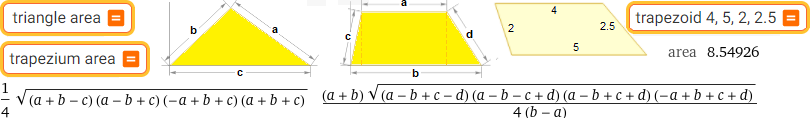
triangle area | trapezium area | trapezoid 4, 5, 2, 2.5
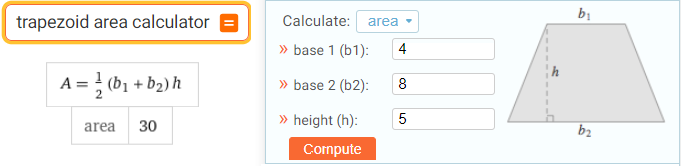
trapezoid area calculator
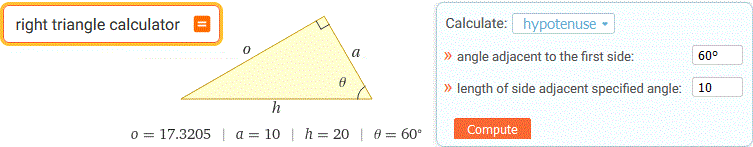
right triangle calculator
rectangle (0,2),(4,-2),(7,1),(3,5), triangle (0,0),(0,4),(-3,0), circle (0,4),(0,0),(3,5) or
polygon (0,2),(4,-2),(7,1),(3,5), polygon (0,0),(0,4),(-3,0), circle (0,4),(0,0),(3,5)
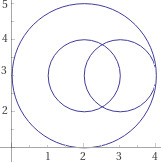
circle (1,3),(1,5),(4,3), rectangle (1,3),(4,5),(4,5),(1,3), rectangle (1,5),(4,3),(1,5),(4,3)
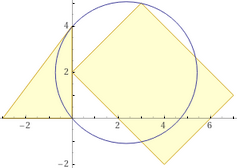
square(center=(0,0),side=2),square(center=(0,0),side=sqrt(2)),circle(center=(0,0),radius=1)
I can draw three figures on the same Cartesian plane
recatangle (a,b),(c,d),(c,d),(a,b) is the segment from (a,b) to (c,d)
 |
 circle center (2,3) radius 2; circle center (2,3) radius 1; circle center(2+1,3) radius 1 |
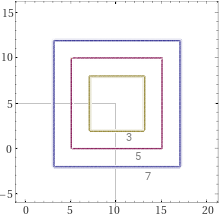
| max(abs(x-10),abs(y-5))=7, max(abs(x-10),abs(y-5))=5, max(abs(x-10),abs(y-5))=3
|  |

minmax sqrt((x+y-z)(x-y+z)(-x+y+z)(x+y+z))/4*0.03 if (10-0.05<x<10+0.05, 14-0.05<y<14+0.05, 8.2-0.05<z<8.2+0.05)
or: min ... and max ...
With a cardboard weighing 300 g per m² I build a triangle with sides of 10.0, 14.0 and 8.2 cm. How much does it weight? [1.21±0.02 g]
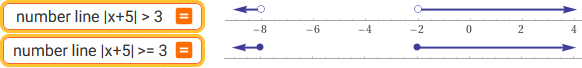
number line |x+5| > 3 | number line |x+5| >= 3
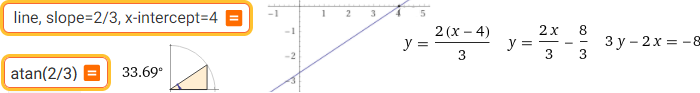
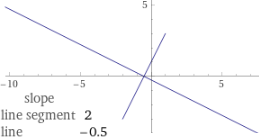
line, slope=2/3, x-intercept=4 | atan(2/3)
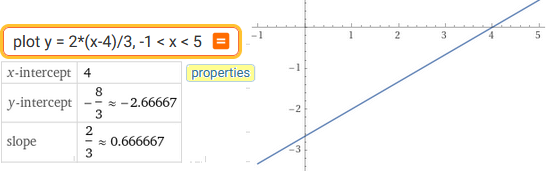
plot y = 2*(x-4)/3, -1 < x < 5
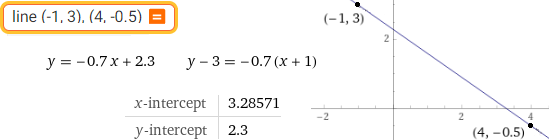
line (-1, 3), (4, -0.5)

complete the square 6x^2+10x+28
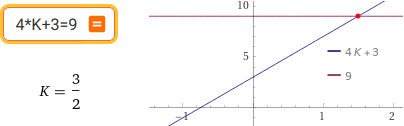
4*K+3 = 9
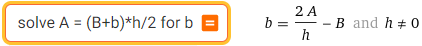
solve A = (B+b)*h/2 for b

distribute a*x+x*c+c*a
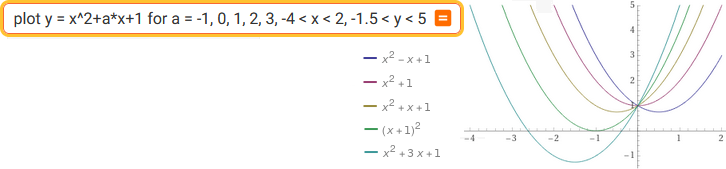
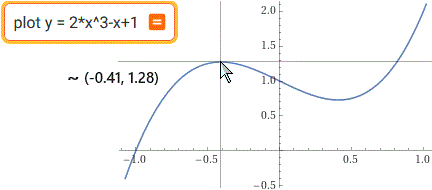
plot y = x^2+a*x+1 for a = -1, 0, 1, 2, 3, -4 < x < 5, -2 < y < 7
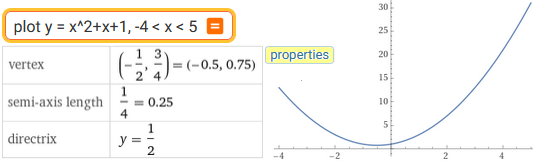
plot y = x^2+x+1, -4 < x < 5
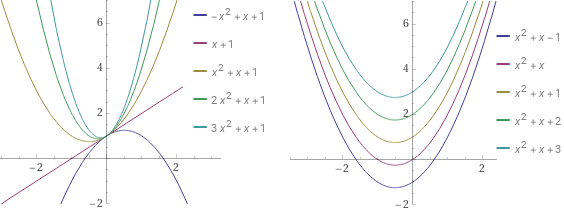
plot y = a*x^2+x+1 for a = -1, 0, 1, 2, 3, -4 < x < 5, -2 < y < 7
plot y = x^2+x+a for a = -1, 0, 1, 2, 3, -4 < x < 5, -2 < y < 7
Quando tracci il grafico di una funzione, per avere una scala monometrica prendi: larghezza = 1.5*altezza (o: altezza = 2/3*larghezza)
When you graph a function, to have a monometric scale take: width = 1.5*height (or: height = 2/3*width)
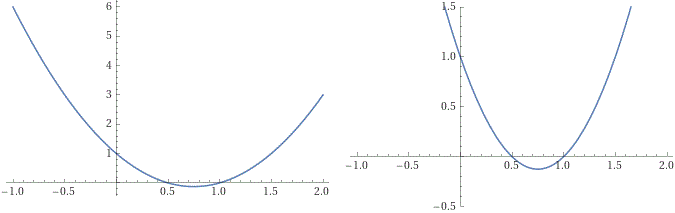
plot y = 2*x*x - 3*x +1, x = -1..2 | plot y = 2*x*x - 3*x +1, x = -1..2, y = -0.5..1.5
 |
Il puntatore del mouse è utile per visualizzare sui due assi le poizioni di un punto dello schermo The mouse pointer is useful for displaying the positions of a point on the two axes |
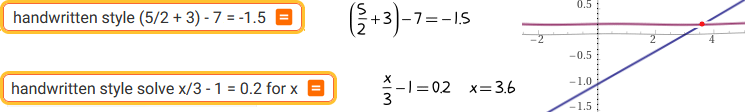
handwritten style (5/2 + 3) - 7 = -1.5 | handwritten style solve x/3 - 1 = 0.2 for x

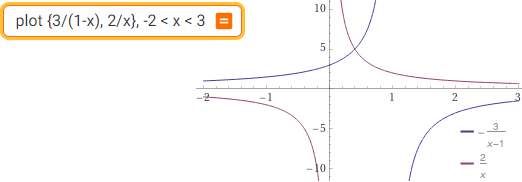
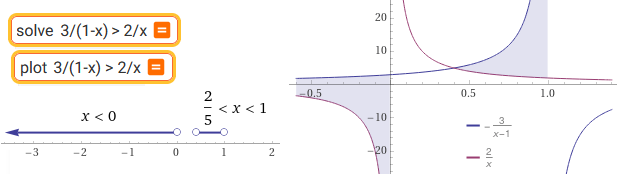
plot {3/(1-x), 2/x}, -2 < x < 3 | solve 3/(1-x) > 2/x | plot 3/(1-x) > 2/x

x^2 >= 9 and 0 <= x < 5 and 64 > x^3 > 8
The period of revolution in years T of the planets (Mercury, Venus, Earth, Mars, Jupiter, Saturn, Uranus, Neptune, Pluto) and their average distance from the Sun D, taken as the unit of measure the Sun-Earth distance: the relationship that links these two variables is of the type D^3 = k*T^2. T = (0.241, 0.615,1.000, 1.881, 11.861,29.457,84.008, 164.784,248.350) D = (0.387, 0.723, 1.000, 1.523, 5.203, 9.541, 19.190, 30.086, 39.507)
(0.387,0.723,1.000,1.523,5.203,9.541,19.190,30.086,39.507)^3 / (0.241,0.615,1.000,1.881,11.861,29.457,84.008,164.784,248.350)^2
{0.997927, 0.999228, 1, 0.99844, 1.0012, 1.00093, 1.00134, 1.00291, 0.999756}

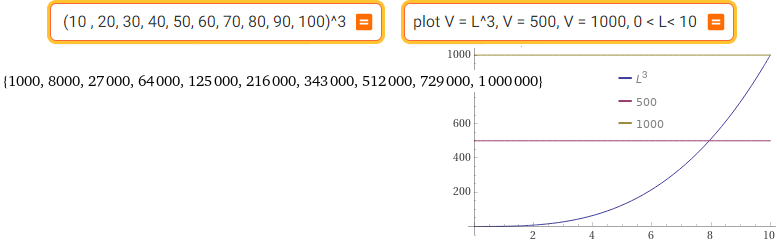
(10 , 20, 30, 40, 50, 60, 70, 80, 90, 100)^3 | plot V = L^3, V = 500, V = 1000, 0 < L < 10
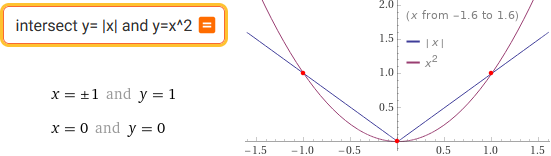
intersect y = |x| and y = x^2
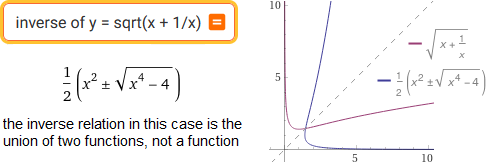
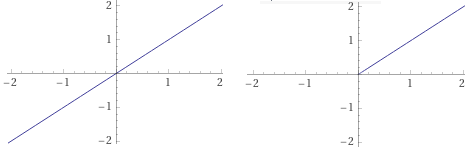
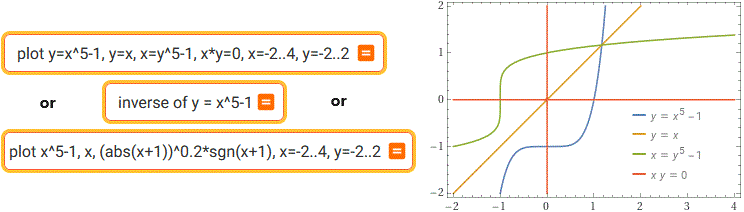
inverse of y = sqrt(x + 1/x) see also/vedi anche

subsets of {a,b,c}
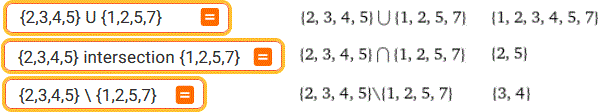
U | intersection | \
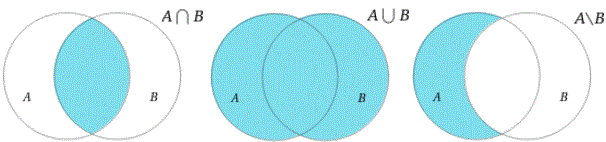
A U B | A intersect B | A \ B

100°C -> °F | 0°C -> °F | 99°F -> °C
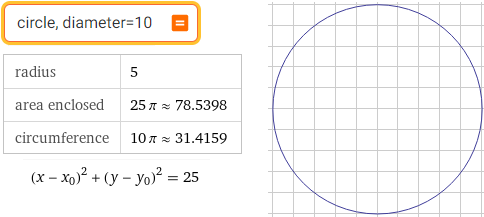
circle, diameter=10
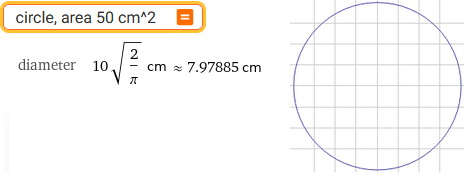
circle, area 50 cm^2

soccer ball
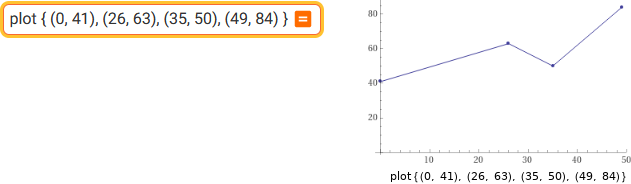
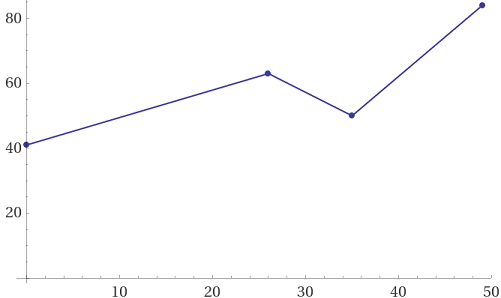
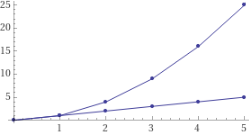
plot { (0, 41), (26, 63), (35, 50), (49, 84) }
 | Puoi aggiungere i comandi sotto al grafico e copiare l'immagine facilmente usando il bottone "Customize" e i "click" opportuni. You can add commands at the bottom of the graph and copy the image easily using the "Customize" button and the appropriate "clicks". Puoi cambiare le dimensioni dell'immagine. You can change the size of the image. |
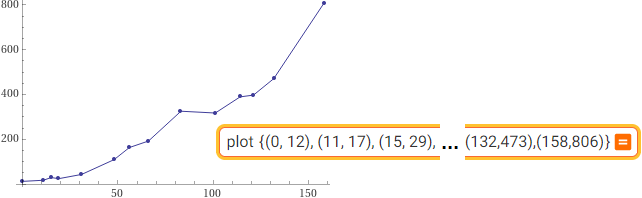
plot {(0, 12), (11, 17), (15, 29), (19, 24),(31,43),(48,109),(56,163),(66,192),(83,325),(101,317),(114,389),(121,397),(132,473),(158,806)}
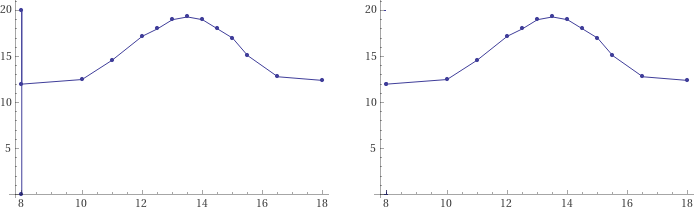
plot {(8,0);(8,20);(8,12);(10,12.5);(11,14.6);(12,17.2);(12.5,18);(13,19);(13.5,19.3);(14,19);(14.5,18);(15,17);(15.5,15.1);(16.5,12.8);(18,12.4)}
Nei grafici per punti non è sempre facile includere la quota y=0. Un semplice trucco è inseire all'inizio un punto alla quota 0 e uno oltre la quota massima.
Poi, volendo, il segmento verticale aggiunto può esere cancellato.
In point plots it is not always easy to include the y=0 axis. A simple trick is to insert points at the start at the quota 0 and one beyond the maximum quota.
Then, if desired, the added vertical segment can be deleted.
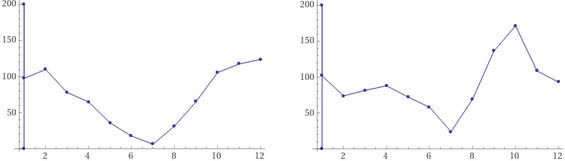
plot {(1,0), (1,200),(1,101.8),(2, 74.0),(3,81.7),(4,88.0),(5,72.4),(6, 58.2),(7,24.2),(8,69.3),(9,136.4),(10,171.3),(11,108.8),(12,93.1)}
plot {(1,0), (1,200),(1,97.5),(2, 109.9),(3,78.2),(4,65.1),(5,36.2),(6, 17.9),(7,6.7),(8,31.8),(9,65.3),(10,105.6),(11,117.5),(12,123.7)}
Questo "trucco" può essere impiegato anche per tracciare grafici per punti con la stessa scala (es: i grafici dei mm di pioggia mensili in due diverse città).
This "trick" can also be used to draw point plots with the same scale (eg: graphs of monthly rainfall in two different cities).
Si può comunque ricorrere a degli script online: vedi "grafici".
| Come costruire istogrammi con intervalli di diversa ampiezza.
/ How to build histograms with intervals of different widths. Two examples. In una certa città, nel 1970, gli abitanti con meno di 15 anni sono il 18%, quelli col almeno 15 anni e meno di 25 il 16.5%, quelli con almeno 25 e meno di 55 il 50%, quelli con almeno 55 e meno di 65 il 10%, quelli con almeno 65 il 5.5%. In a certain city, in 1970, the inhabitants under the age of 15 are 18%, those with at least 15 years and under 25 16.5%, those with at least 25 and under 55 50%, those with at least 55 and less than 65 10%, those with at least 65 5.5%.
|
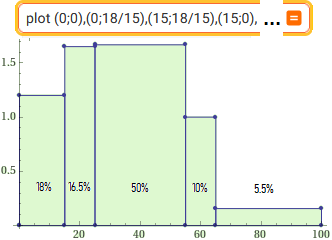 | |||
| plot {(0,0);(0,18/15);(15,18/15);(15,0);(15,16.5/10);(25,16.5/10);(25,0);(25,50/30);(55,50/30);(55,0);(55,10/10);(65,10/10);(65,0);(65,5.5/35);(100,5.5/35);(100,0);(0,0)} | ||||
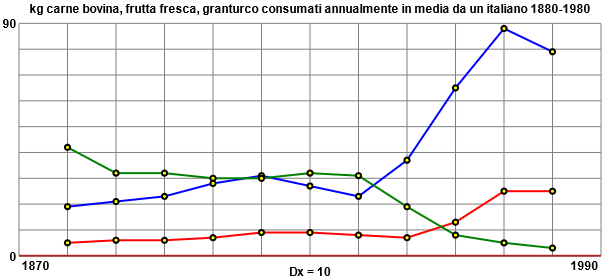
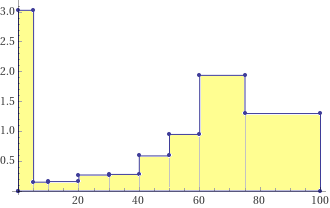
In Italy in 1951, in
the age intervals [0,5),[5,10),[10,20),[20,30),[30,40),[40,50),[50,60),[60,75),[75,100)
are dead 729,35,77,132,134,285,457,1401,1569 thousand people. The histogram represents
the unitary percentage frequencies: the percentage frequencies divided by the
amplitude of each interval, so that the area of each vertical rectangle represents the percentage
frequency of the outputs that fall in the interval that is the base. The sum of the
areas of the rectangles is 100. (see here) 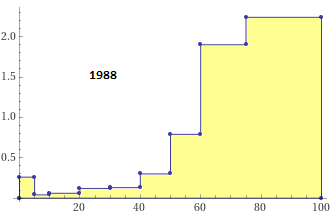 |
 |
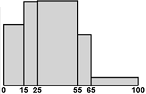
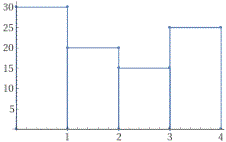 | ← Anche gli istogrammi a barre / Also bar charts |
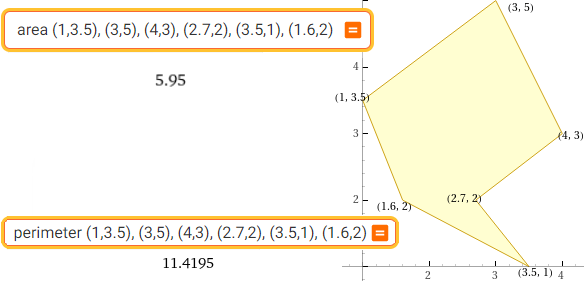
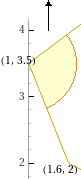
area (1,3.5), (3,5), (4,3), (2.7,2), (3.5,1), (1.6,2) | perimeter (1,3.5), (3,5), (4,3), (2.7,2), (3.5,1), (1.6,2)
plot (5,15),(15,5),(50,5),(70,15),(30,15),(60,30),(25,65),(25,15),(5,15) | polygon ... ,(25,15) color red
polygon (5,15),(15,5),(50,5),(70,15),(30,15),(60,30),(25,65),(25,15); polygon (0,0),(0,0)
area = 1412.5 perimeter = 5 (29 + 9 sqrt(2) + 5 sqrt(5)) ≈ 264.541
|
By adding a second command "polygon P,P" I avoid the appearance of the coordinates of the points and I can make the image contain the point P ↑ By adding another "polygon(150,150),(150,150)" I can enlarge the part of the plane represented and then reduce the drawing → |
 |
angle between (0.6,-1.5) and (2,1.5) or angle between vectors (0.6,-1.5) and (2,1.5)
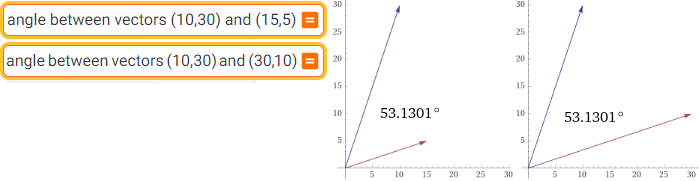
angle between (10,30) and (15,15) | angle between (10,30) and (30,10)
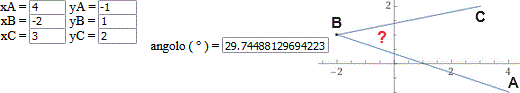
angolo ABC
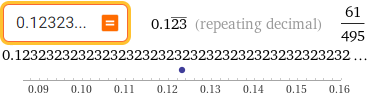
0.12323...
As we have seen above, every number with a terminating decimal representation (0.3) is an abbreviation of a repeating decimal representation with a repetend of 0 (0.3000...) or with a repetend of 9 (0.2999...). 0.3000... in base 2 becomes 0.01001100110011... (the repeating sequence is 0011, or 1100 or 0100 or 1001). See the command [base = ].

(2.33...)/(0.71414...)*(41.66...)

100

number name 1264857.03

one million two hundred sixty-four thousand eight hundred fifty-seven point zero three
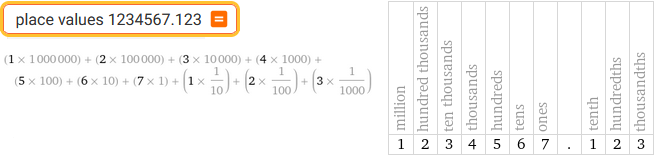
place values 1234567.123
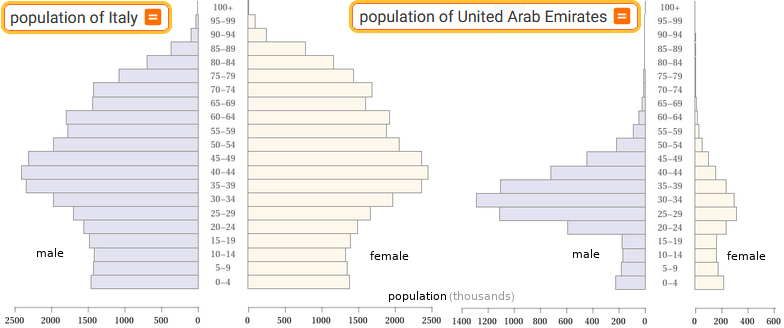
population of Italy | population of United Arab Emirates

shoe size

car | bicycle | motorcycle
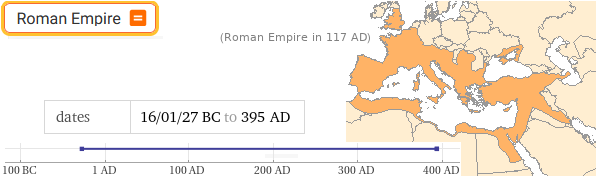
Roman Empire
 | Ukraine | Ukrainian | Ukraine regions |
 |
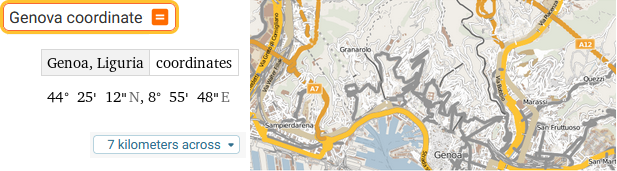
Genova coordinate
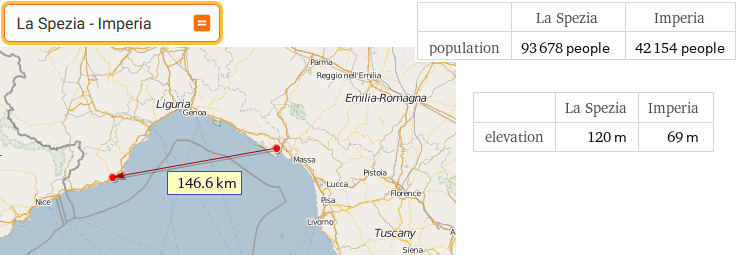
La Spezia - Imperia
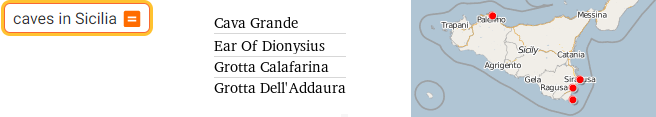
caves in Sicilia
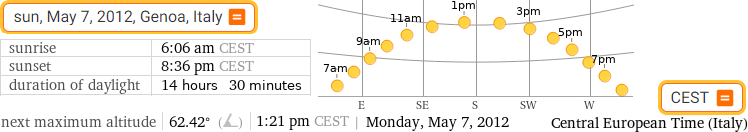
sun, May 7, 2012, Genoa, Italy
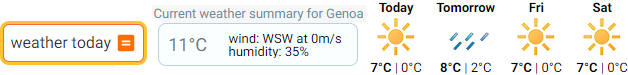
weather today
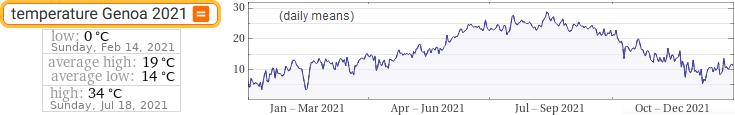
temperature Genoa 2021

calendar 1980

7/8/1971 to 7/8/2011

blue+yellow
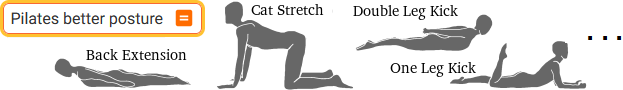
Pilates better posture see also/vedi anche
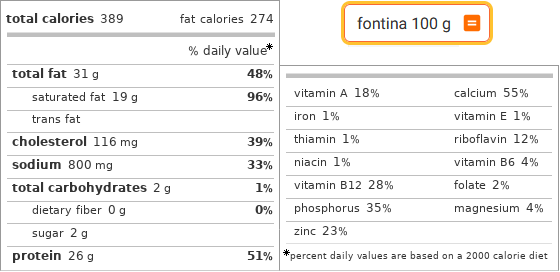
fontina 100 g
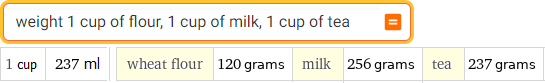
weight 1 cup of flour, 1 cup of milk, 1 cup of tea

biology
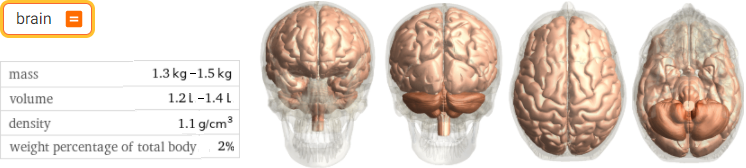
brain
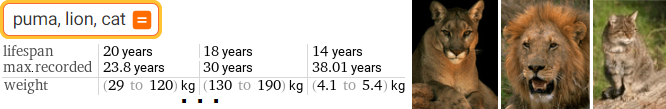
puma, lion, cat
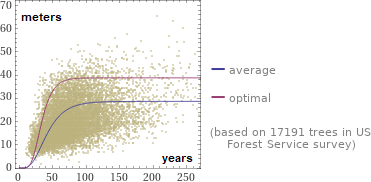
growth curve fir tree (abete)
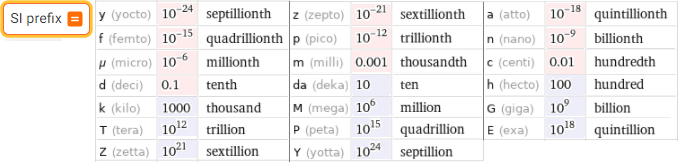
SI prefix
 | libra=? kg | foot=? cm | can=? l | pint=? l | Kelvin=? Celsius |
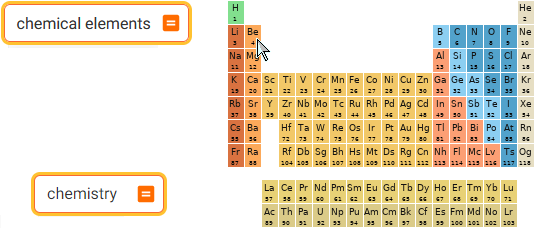
chemical elements | chemistry
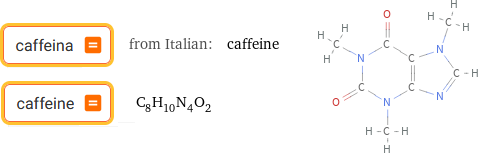
caffeine
 | molecular mass of water |
 | atomic mass of He |
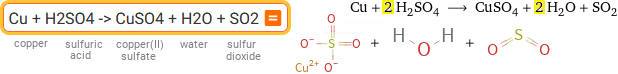
Cu + H2SO4 -> CuSO4 + H2O + SO2

ISBN 9788836548033

QR code "Genova"

F# G G A G C B G G A G D C | music theory | intervals C3 Eb3 Bb3 D4 G4 C3 Eb3 Bb3 D4 G4

m__n

fr_ct___

words start q end w

words start italia

words contain division
 pronunciation of mean | IPA: vedi/see |

postfix notation vedi/see
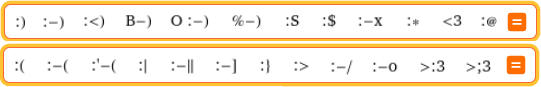

Emoticon. Introduci:
:) :-) :<) B-) O:-) %-) :S :$ :-X :* <3 :@
:( :-( :'-( :| :-|| :-] :} :> :-/ :-o >:3 >;3

CAPTCHA "G. Marconi"

Ada Lovelace | Anne Isabella Byron | Archimedes | Bertrand Russell | Enrico Fermi | Euler | Newton | Galileo Galilei | Godel | Pythagoras
Giotto | artworks of Giotto | ... Leonardo | ... Raffaello | ... Monet | ... Renoir | ... Van Gogh | ... Kandinsky | ... Matisse | ... Klee | ... Picasso | ... Modigliani | artworks of Giorgio De Chirico
| James Bond movies |
 | ... |

mobile phone | phone
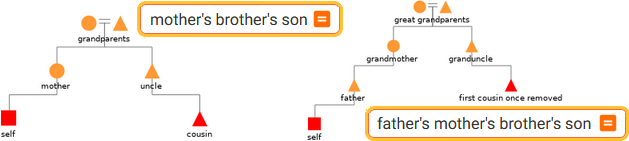
mother's brother's son (il figlio del fratello della madre) | father's mother's brother's son (il figlio del fratello della madre del padre)

didactics
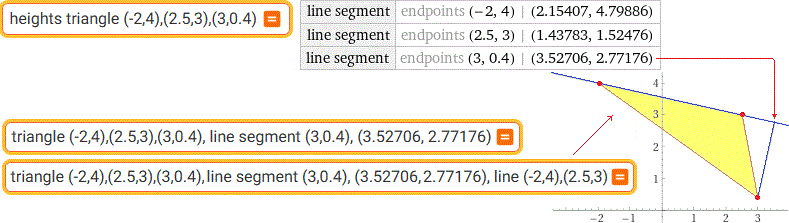
heights triangle (-2,4),(2.5,3),(3,0.4) altezze di un triangolo
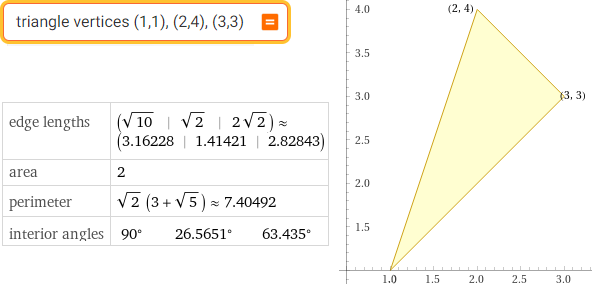
triangle vertices (1,1),(2,4),(3,3)
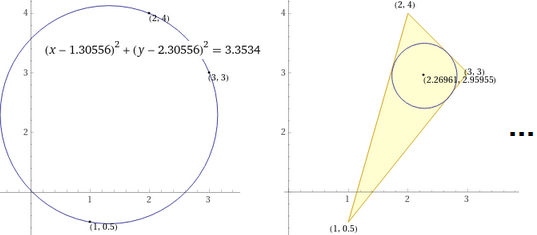
circle (1,0.5), (2,4), (3,3) | incenter (1,0.5), (2,4), (3,3)
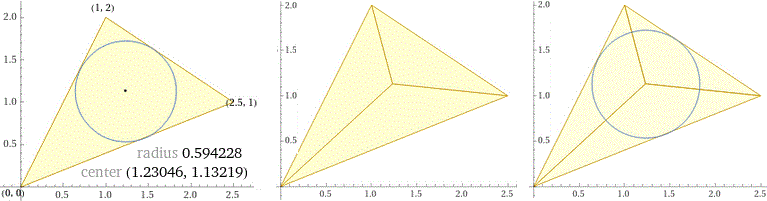
incircle triangle (2.5,1),(1,2),(0,0)
triangle (2.5,1),(0,0),(1.23046,1.13219), triangle (2.5,1),(1,2),(1.23046,1.13219), triangle (0,0),(1,2),(1.23046,1.13219)
polygon (1.23046, 1.13219),(2.5,1),(0,0),(1.23046,1.13219),(2.5,1),(1,2),(1.23046,1.13219),(0,0),(1,2), circle center (1.23046,1.13219) radius 0.594228
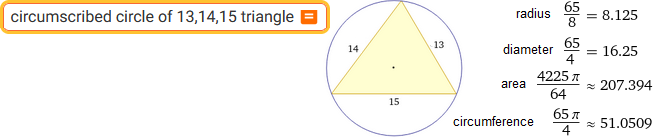
circumscribed circle of 13,14,15 triangle | inscribed circle ...
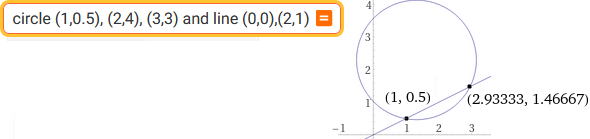
circle (1,0.5), (2,4), (3,3) and line (0,0),(2,1)
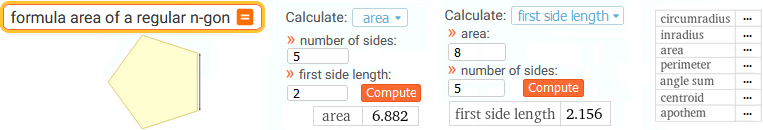
formula area of a regular n-gon
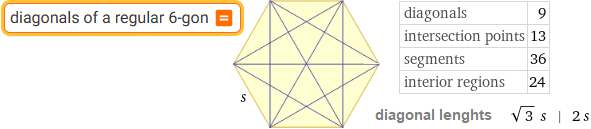 | diagonals of a regular 6-gon |

divisors 20 | divisors 20,16,28,180 | gcd(20,16,28,180) | lcm(20,16,28,180)
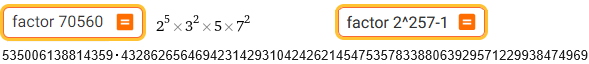
factor 70560 | factor 2^257-1


primes from 40 to 100 | primes near 500000

primes of the form 100k+1
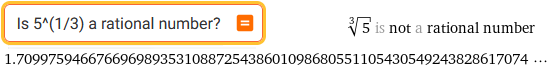
Is 5^(1/3) a rational number?

pi

17.03 from base 10 to base 2

120.33 from base 10 to base 60 | 120.3333333333 from base 10 to base 60 | 120.333333333333333 from base 10 to base 60
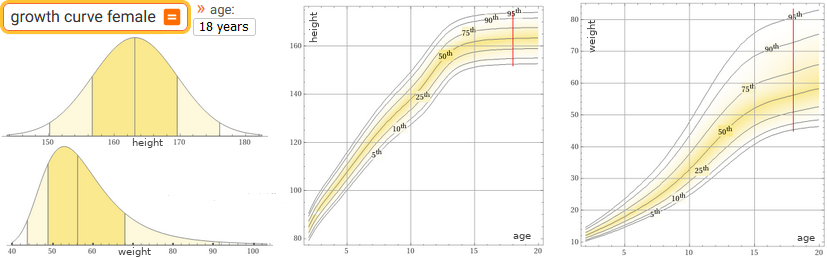
growth curve female
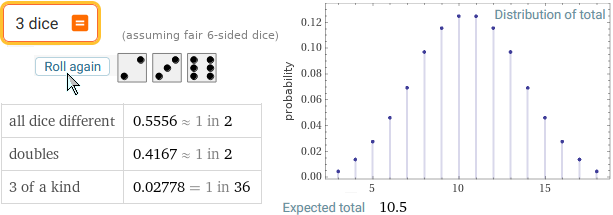
3 dice
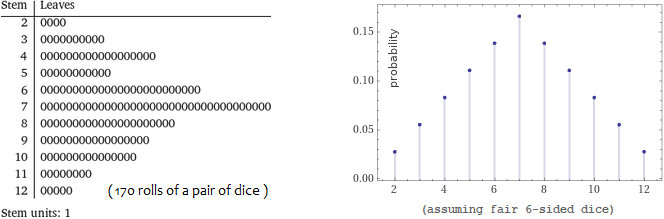
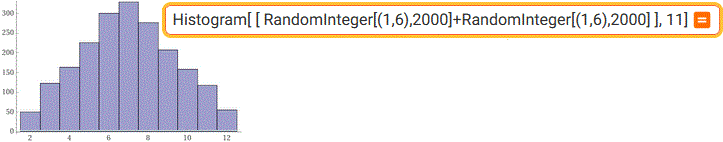
RandomInteger[(1,6),170]+RandomInteger[(1,6),170] | 2 dice
Or:
(RandomReal[{0,10},100]+RandomReal[{0,10},100]+RandomReal[{0,10},100]+ RandomReal[{0,10},100]+ RandomReal[{0,10},100]+ RandomReal[{0,10},100]+ RandomReal[{0,10},100])
 (0.42051, 0.309013, ..., 1.76063, 0.914661) RandomReal[{0,1},3000]+RandomReal[{0,1},3000] |
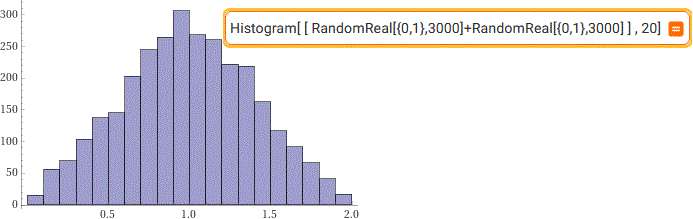
Histogram[ [ RandomReal[{0,1},3000]+RandomReal[{0,1},3000] ], 20]
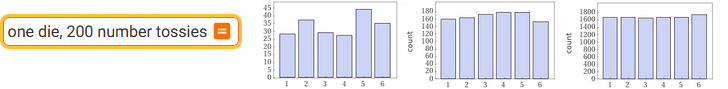
one die, 200 number tossies | one die, 1000 number tossies | one die, 10000 number tossies

probability union events
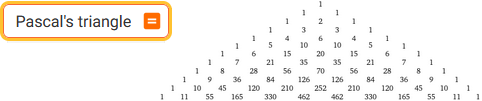
Pascal's triangle
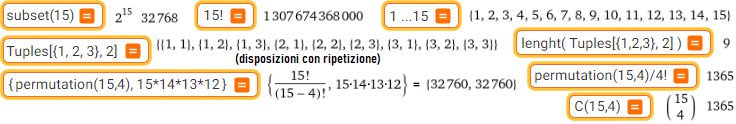
subset(15) | 15! | 1..15 | Tuples[{1,2,3},2} | permutaion (15,4) | permutaion (15,4)/4! | C(15,4)
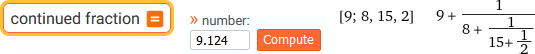
continued fraction
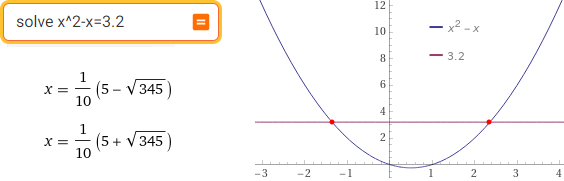
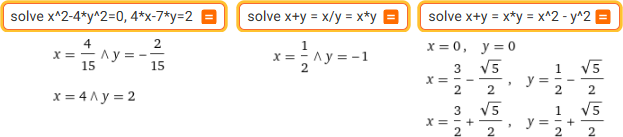
solve x^2-x=3.2
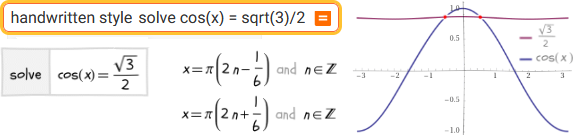
handwritten style solve cos(x) = sqrt(3)/2
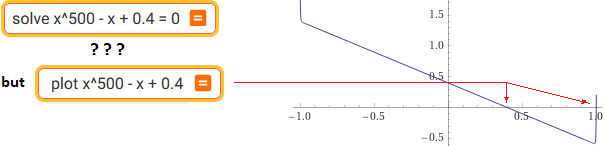
solve x^500 - x + 0.4 = 0 | plot x^500 - x + 0.4
"solve" does not always provide the solutions. What to do? See here
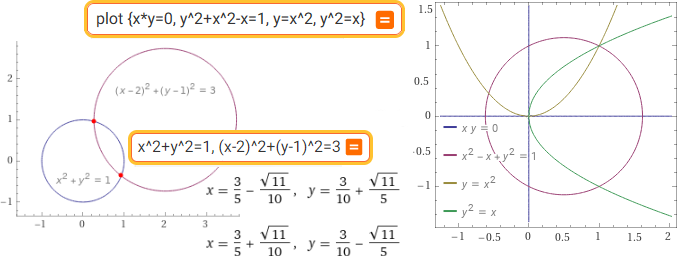
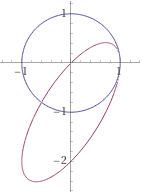
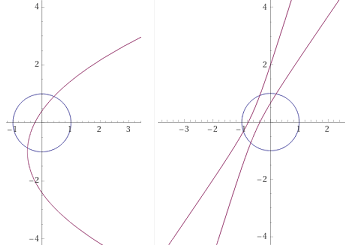
plot {x*y=0, y^2+x^2-x=1, y=x^2, y^2=x} | x^2+y^2=1, (x-2)^2+(y-1)^2=3
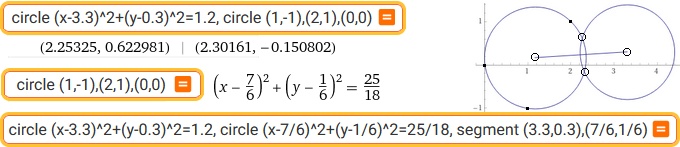
circle (x-3.3)^2+(y-0.3)^2=1.2, circle (1,-1),(2,1),(0,0) | circle (1,-1),(2,1),(0,0)
circle (x-3.3)^2+(y-0.3)^2=1.2, circle (x-7/6)^2+(y-1/6)^2=25/18, segment (3.3,0.3),(7/6,1/6)
I know the radii of two circles and the distance of the centers; how to draw the tangent to both
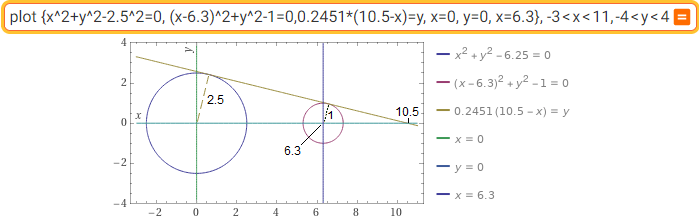
solve x/2.5 = (x-6.3)/1 (10.5) | 2.5/sqrt(10.5^2-2.5^2) (0.2451)
plot {x^2+y^2-2.5^2=0, (x-6.3)^2+y^2-1=0,0.2451*(10.5-x) =y, x=0, y=0, x=6.3}, -3 < x < 11, -4 < y < 4
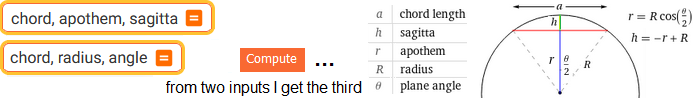
chord, apothem, sagitta | chord, radius, angle
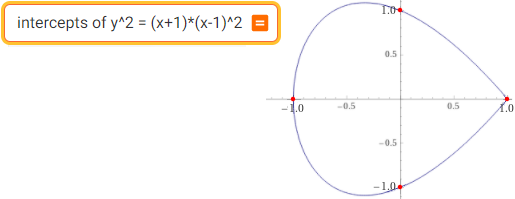
intercepts of y^2=(x+1)*(x-1)^2
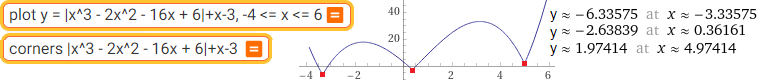
plot y = |x^3 - 2x^2 - 16x + 6|+x-3, -4 <= x <= 6 | corners |x^3 - 2x^2 - 16x + 6|+x-3
| domain of sqrt(x^2-1) | 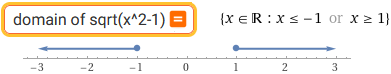 |
| domain and image of 3x/(x-2)^2 |  |
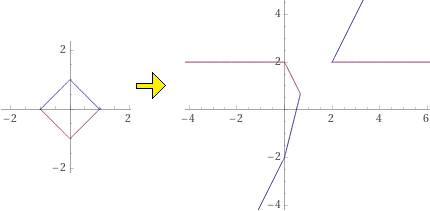
Come restringere il dominio di una funzione a un intervallo J? Un trucco: aggiungere un termine che vale 1/0 al di fuori di J
How to restrict the domain of a function to an interval J? A trick: add a term that is 1/0 outside of J
Per restringermi a [A,∞) o a (-∞,B] posso aggiungere / To restrict to [A,∞) or (-∞,B] I can add
+1/sqrt((sgn( A -x)-1)^2)-1/abs(sgn( A -x)-1)
+1/sqrt((sgn( B -x)-1)^2)-1/abs(sgn( B -x)-1)
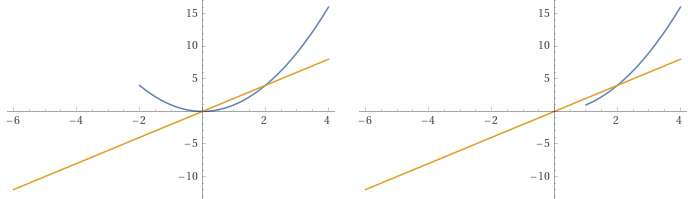
I grafici di x → x^2 e di x → 2*x restringendo il dominio della prima funzione a (-2,∞), (1,∞), (-∞,2), (-3,2)
plot y=x^2+1/sqrt((sgn( A -x)-1)^2)-1/abs(sgn( A -x)-1), y=2x, x = -6..4 for A = -2
plot y=x^2+1/sqrt((sgn( A -x)-1)^2)-1/abs(sgn( A -x)-1), y=2x, x = -6..4 for A = 1
plot y=x^2+1/sqrt((sgn( B -x)+1)^2)-1/abs(sgn( B -x)+1), y=2x, x = -6..4 for B = -2
plot y=x^2+1/sqrt((sgn( A -x)+1)^2)-1/abs(sgn( A -x)+1)+1/sqrt((sgn( B -x)-1)^2)-1/abs(sgn( B -x)-1), y=2x, x = -5..5 for A=2, B=-3
Alternativa / Alternative: (-10 < -3, 10 > 4)
plot piecewise [{{ x^2-1, x >= -1 && x <= 2} , {10, x > 2}, {-5, x < -1}} ], x= -2..3, y= -3..4
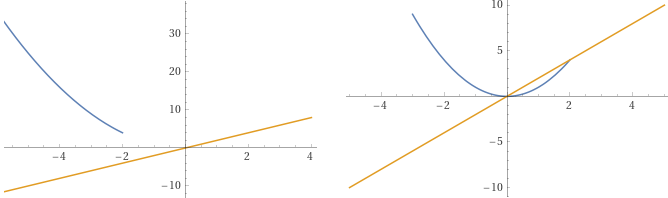
Attention! On the left, the graph of x → x^x ; part G is the graph where the function is continuous. The command "plot" plots only this part.
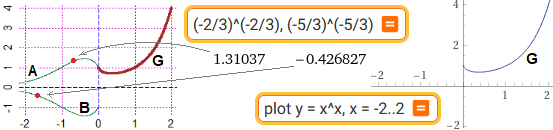
plot y = x^x, x = -2..2
Attention! (sqrt(4*x)/sqrt(x) → sqrt(4*x) → 2)
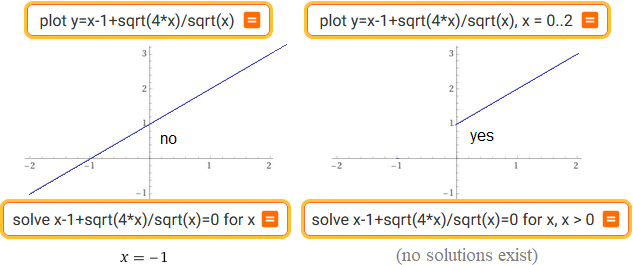 (see below)
y = x-1+sqrt(4*x)/sqrt(x)
Attention!
La composizione di alcune funzioni (definite anche su numeri complessi che non sono reali) può comportarsi come definita anche dove non lo è.
The composition of some functions (also defined on complex numbers that are not real numbers) can behave as defined even where it is not.
An example: exp( log(x) ) = x also for x ≤ 0, although for x ≤ 0 log(x) does not have a real number as value

We can plot the graph of exp(log(.)) by assigning x ≤ 0 outputs that are outside the graph.

Alternativa / An alternative (see):
plot exp(log(x))+1/sqrt((sgn( -x)-1)^2)-1/abs(sgn(-x)-1), x-x, x = -2..2, y = -2..2
See above: plot piecewise[ { {x-1+sqrt(4*x)/sqrt(x), x > 0}, {1e10, x<=0} }], x=-2..2, y=-1..3
Attention! Il calcolo di (-3)^0.2 è eseguito correttamente solo se si scrive (-3)^(1/5) altrimenti l'input viene interpretato nell'ambito dei numeri complessi
The calculation of (-3)^0.2 is performed correctly only if (-3)^(1/5) is written, otherwise the input is interpreted in the context of complex numbers.


A destra il risultato di questa calcolatrice2 / On the right the result of this "calcolatrice2"
Attention! In WolframAlpha x^y è definito solo per x≥0. Di fronte a (-32)^(1/5) (=-2) devo calcolare
Attention! Se traccio un grafico con un computer non è detto che venga evidenziata la presenza di "buchi"
If I draw a graph with a computer it is not certain that the presence of "holes" will be highlighted
plot piecewise [{ {x+1, x > 1/3}, {x+1, x < 1/3} , {2.5, x=1/3} }], x=-1..1.5
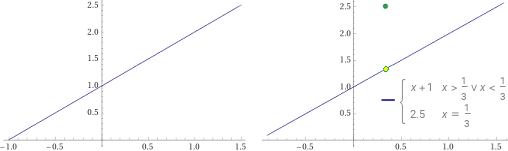
is not continuous on R x = 1/3 removable discontinuity
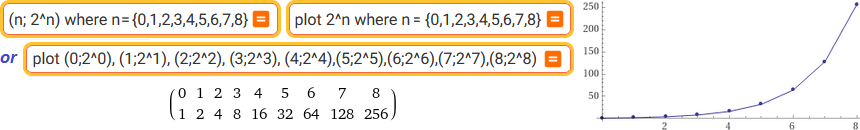
plot (0;2^0), (1;2^1), (2;2^2), (3;2^3), (4;2^4),(5;2^5),(6;2^6),(7;2^7),(8;2^8)
 |  plot {(5;5^2),(4;4^2),(3;3^2),(2;2^2),(1;1),(0;0),(1,1),(2;2),(3;3),(4;4),(5;5)} |
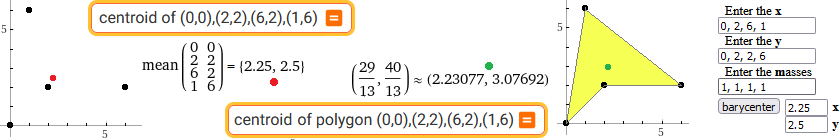
centroid of (0,0),(2,2),(6,2),(1,6) | centroid of polygon (0,0),(2,2),(6,2),(1,6) | polygon centroid → "area polig" qui/here
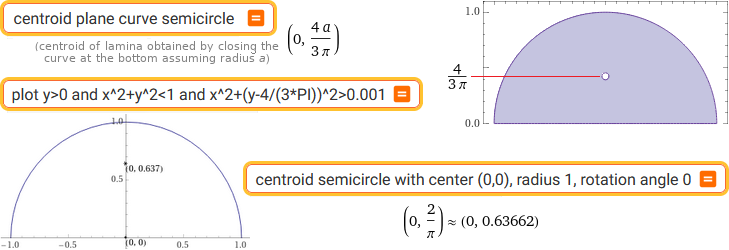
centroid plane curve semicircle | plot y>0 and x^2+y^2<1 and x^2+(y-0.5)^2>0.01
centroid semicircle with center (0,0), radius 1, rotation angle 0
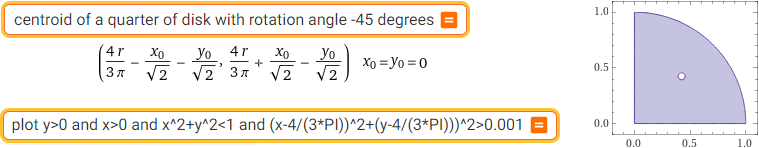
centroid of a quarter of disk with rotation angle -45 degrees
plot y>0 and x>0 and x^2+y^2<1 and (x-4/(3*PI))^2+(y-4/(3*PI)))^2>0.001
rotation transform calculator
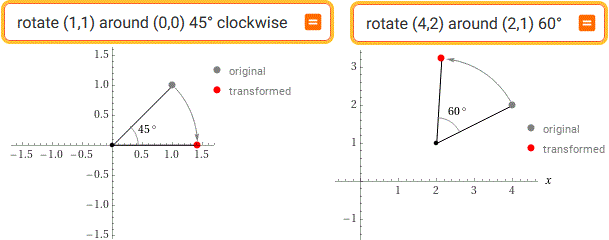
rotate (1,1) around (0,0) 45° clockwise | rotate (4,2) around (2,1) 60°

polygon(1,1),(5,1),(5,3), polygon(1*cos(210°)-1*sin(210°), 1*sin(210°)+1*cos(210°)),(5*cos(210°)-1*sin(210°), 5*sin(210°)+1*cos(210°)),(5*cos(210°)-3*sin(210°), 5*sin(210°)+3*cos(210°))
Per ruotare di A i vertici (x,y) un poligono attorno a (0,0): (x,y) → (x*cos(A)-y*sin(A), x*sin(A)+y*cos(A))
To rotate the vertices (x,y) of a polygon around (0,0) by A: (x,y) → (x*cos(A)-y*sin(A), x*sin(A)+y*cos(A ))
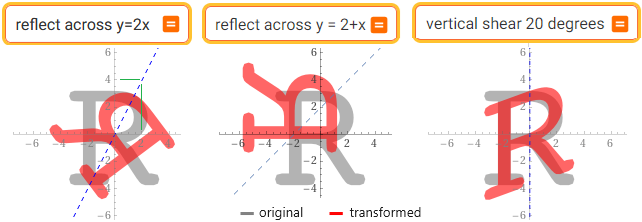
reflect across y=2x | reflect across y=2+x | vertical shear 20 degrees vedi/see
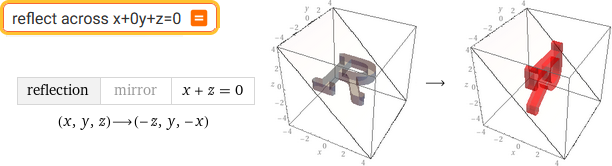
reflect across x+0y+z=0
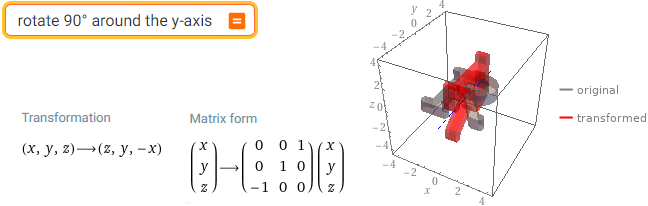
rotate 90° around the y-axis
| symmetry with respect to y = -x+2; translation x → x+4, y → y-4; rotation of -90° around (0,0); a non-monometric scale transformation + a translation | 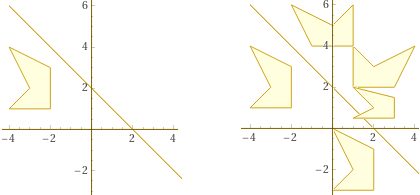 |
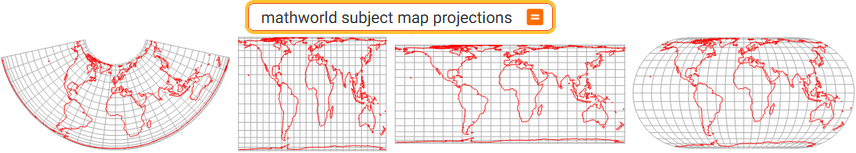
mathworld subject map projections vedi/see
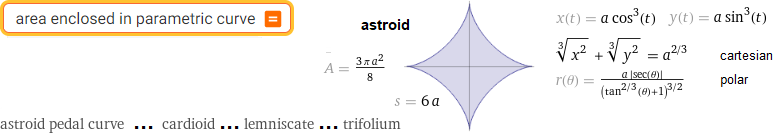
area enclosed in parametric curve
 |  parametric plot (cos(t),sin(t)), parametric plot (cos(t),sin(t)+cos(t)-1) the circle transformed by (x,y) → (x, y + x - 1)  parametric plot (cos(t),sin(t)), parametric plot (cos(t)-1,sin(t)+1.5) a translation: (x,y) → (x - 1, y + 1.5) | 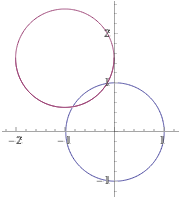 |
 | The transformations x' = x / (y - x - q), y' = (x + y) / (y - x - q) with q = √2 and q = 1/2 |
parametric plot (cos(t),sin(t)), parametric plot ( cos(t)/(sin(t)-cos(t)-1/2), (cos(t)+sin(t))/(sin(t)-cos(t)-1/2) ), t=0..2*PI
 | The transformation x' = x / (x - 1/2), y' = ( x+ y) / (x - 1/2) of the square |x| + |y| = 1 |
parametric plot (t, 1-abs(t)), parametric plot (t, -1+abs(t)), t = -1..1
parametric plot (t/(t-1/2) ,(t+1-abs(t))/(t-1/2) ), parametric plot (t/(t-1/2) ,(t-1+abs(t))/(t-1/2) ), t = -1..1
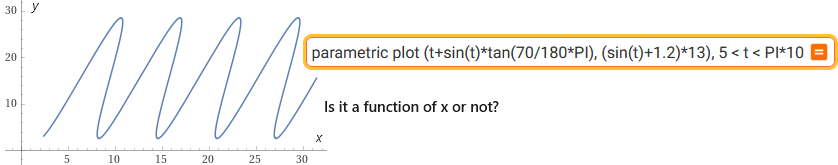
parametric plot (t+sin(t)*tan(70/180*PI), (sin(t)+1.2)*13), 5 < t < PI*10
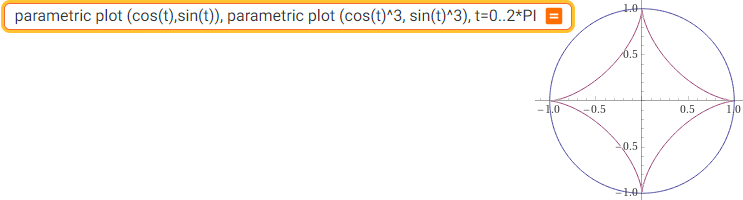
parametric plot (cos(t),sin(t)), parametric plot (cos(t)^3, sin(t)^3), t=0..2*PI
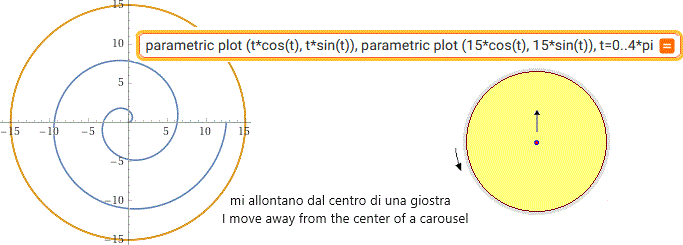
parametric plot (t*cos(t), t*sin(t)), parametric plot (15*cos(t), 15*sin(t)), t=0..4*pi

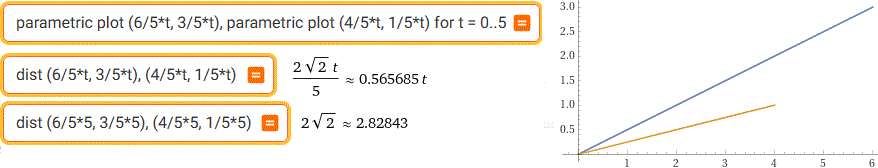
parametric plot (6/5*t, 3/5*t), parametric plot (4/5*t, 1/5*t) for t = 0..5
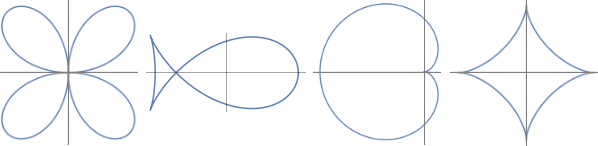
quadrifolium | fish curve | cardioid | astroid
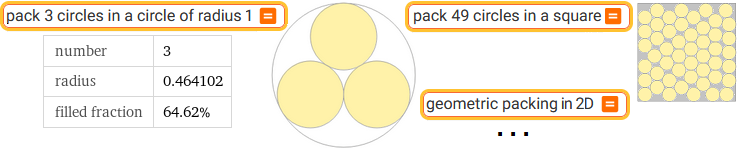
pack 3 circles in a circle of radius 1 | pack 49 circles in a square | geometric packing in 2D
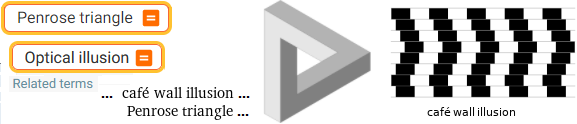
Penrose triangle | Optical illusion
dissection fallacy | Curry triangle | Haberdasher's problem | tangram paradox | impossible figure | paradox
 | mathworld subject tessellation M.C. Escher vedi/see Escher's Theorem |

(1+V)^2/(V^2+V) | (x-2)/(x^2-x+1)-1/(x+1)+(x^2+x+3)/(x^3+1)

simplify (x-y)*z+(x+y)*z | expand {sin(x+y), cos(x+y)}

factor x^5-3*x^2+x+1

gcd(x^4+2*x^3+x^2+2*x, x^5+2*x^4-x-2)

quotient and remainder of (3*x^4-x^3) / (x^2-x+2)

x*3 + y/4 = 15, x - 5*y = 2/7
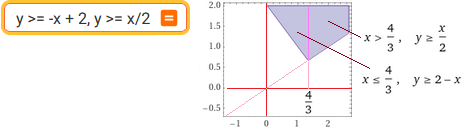
y >= -x + 2, y >= x/2

x+y+z=1, x-y-3*z=1, x+2*y+z=0
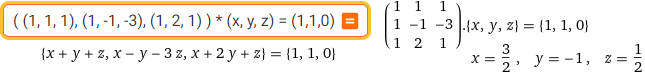
( (1, 1, 1), (1, -1, -3), (1, 2, 1) ) * (x, y, z) = (1,1,0)

1/8*(0...8)
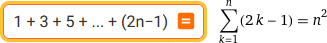 | 1 + 3 + 5 + ... + (2n-1) |

2 * 4 * 6 * 8 * ... * 30 | 1/2 + 1/4 + 1/8 + 1/16 + ...
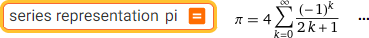 | series representation pi |

sum 1/(1+n^2), n = -oo to oo | coth

f(n+1)=f(n)/2, f(0)=1 | a(0) = 1, a(n+1) = a(n)+n^2 | 2^-n, n -> oo

Q(1)=1, Q(2)=1, Q(n+2)=Q(n)+Q(n+1) | fibonacci sequence
 | ← Se il grafico prosegue in modo analogo quali sono le successive ordinate? / If the graph continues in a similar way, what are the subsequent ordinates? [il grafico/the graph: plot (0,-1),(1,3),(2,5),(3,-7),...,(14,29)] |
 | |
 -1, 3, 5, -7, 9, 11, -13, 15, 17, -19, 21, 23, -25, 27, 29, -31, 33, 35, -37, 39, 41, -43, 45, 47, -49, 51, 53, -55, 57, 59, -61, 63, 65, -67, 69, 71, -73, 75, 77, -79, 81, 83, -85, 87, 89, -91, 93, 95, ... | |
 
|
| range of (1 - 2*x)/(x - 2) for x > 1 or image of (1 - 2*x)/(x - 2) for x > 1 |  |

{0.805396, 0.366574, 0.336665, 0.333667, 0.333367, 0.333337, 0.333334, 0.333333}
round( (tan(x)-sin(x)+1-cos(x)) / (x^2+1-cos(x)), 0.000001) if x=1,1e-1,1e-2,1e-3,1e-4,1e-5,1e-6,1e-7

lim (sin(x)-x)/x^3 as x -> 0
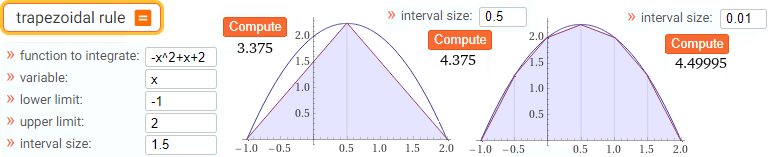
trapezoidal rule
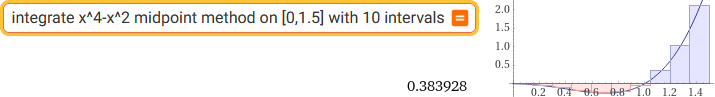
integrate x^4-x^2 midpoint method on [0,1.5] with 10 intervals
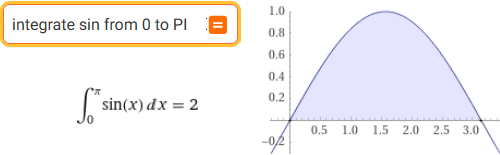
integrate sin from 0 to PI

definite integrals containing exp | integrals containing log | ... sqrt | ... cos | ...

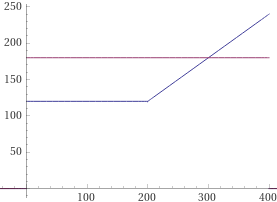
solve piecewise [{ {120, 0 < x <= 200}, { 120 + 0.6*(x-200), 200 < x < 400} }] = 180 → x = 300
(a piecewise function is a function that is defined on a sequence of intervals; "if then else" is not used in WolframAlpha)
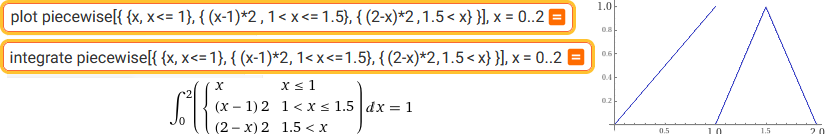
plot piecewise[{ {x, x <= 1}, { (x-1)*2 , 1 < x <= 1.5}, { (2-x)*2 , 1.5 < x} }], x = 0..2 | integrate ...

int sin(x)/x dx, x=0..infinity
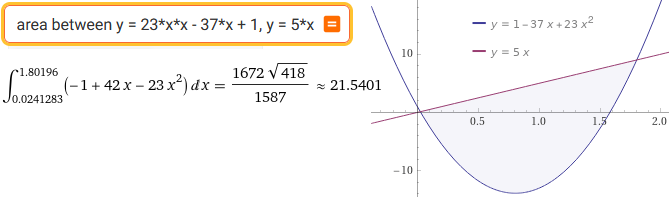
area between y = 23*x*x - 37*x +1, y = 5*x
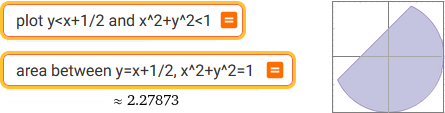
plot y<x+1/2 and x^2+y^2<1 | area between y=x+1/2, x^2+y^2=1
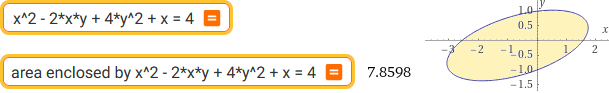
area enclosed by x^2 - 2*x*y + 4*y^2 + x = 4

d/dx cos(x)^2*x | d/dx cos(x)^2*x, x=0 or: f(x) = cos(x)^2*x, f'(x) | f(x) = cos(x)^2*x, f'(0)
 where x*(x^2-4) is increasing?
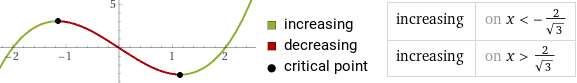
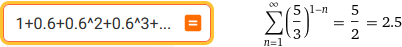
1+0.6+0.6^2+0.6^3+...

product (1-1/k^2), k=2 to oo
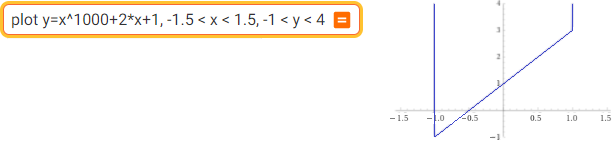
plot y=x^1000+2*x+1, -1.5 < x < 1.5, -1 < y < 4
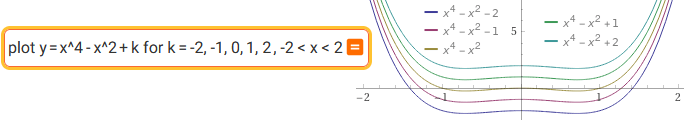
plot y = x^4 - x^2 + k for k = -2, -1, 0, 1, 2, -2 < x < 2
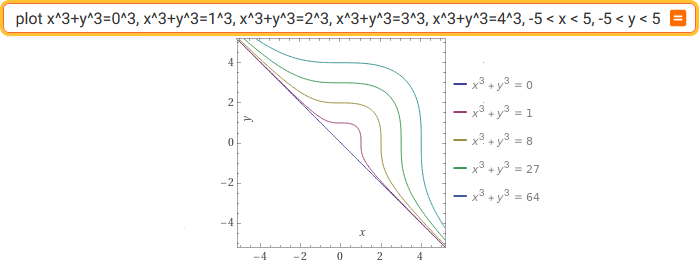
plot x^3+y^3=0^3, x^3+y^3=1^3, x^3+y^3=2^3, x^3+y^3=3^3, x^3+y^3=4^3, -5 < x < 5, -5 < y < 5
| (x^2+y^2-4)(x^2+y^2-9) < 0 | 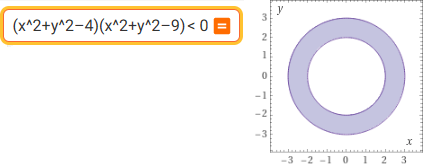 |
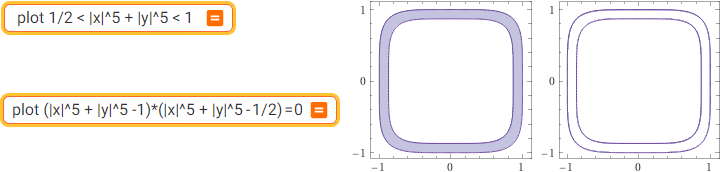
plot 1/5 < |x|^5+|y|^5 < 1/2 | plot (|x|^5+|y|^5 -1)*(|x|^5+|y|^5 - 1/2)=0
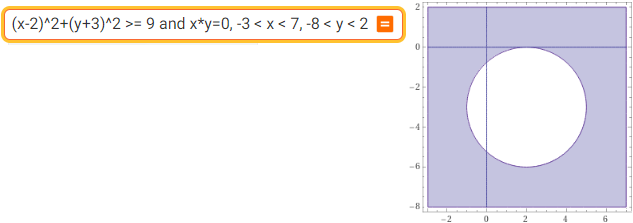
(x-2)^2+(y+3)^2 >= 9 and x*y=0, -3 < x < 7, -8 < y < 2
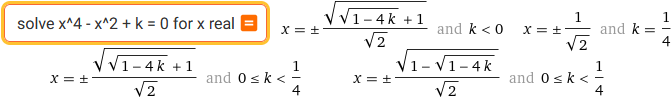
solve x^4 - x^2 + k = 0 for x real
 (3n+85)/(n+5) = m | A problem with integers: What are the positive integers n for which the number 65, 30, 9, 5, 2 | |
| {{m == -67, n == -6}, {m == -32, n == -7}, {m == -11, n == -10}, {m == -7, n == -12}, {m == -4, n == -15}, {m == -2, n == -19}, {m == 1, n == -40}, {m == 2, n == -75}, {m == 4, n == 65}, {m == 5, n == 30}, {m == 8, n == 9}, {m == 10, n == 5}, {m == 13, n == 2}, {m == 17, n == 0}, {m == 38, n == -3}, {m == 73, n == -4}} | ||

laws of physics

Second law of thermodynamics

length, time, mass, volume, density, acceleration, force, energy, electric current, magnetic moment
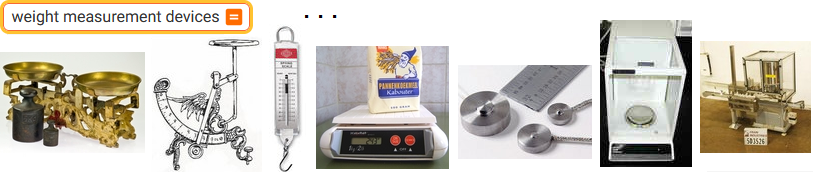
weight measurement devices
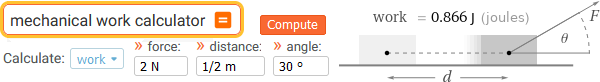
mechanical work calculator
stopping distance | pendulum | spring pendulum | coupled pendulum | ...
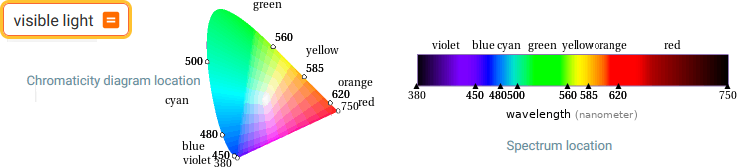
visible light
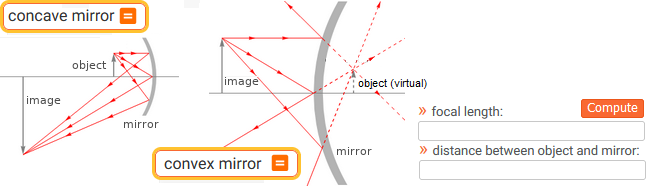
concave mirror | convex mirror

play 800 Hz sine wave | play 640 Hz sawtooth wave | play 500 Hz square wave
music theory | F# G G A G C B G G A G D C vedi/see
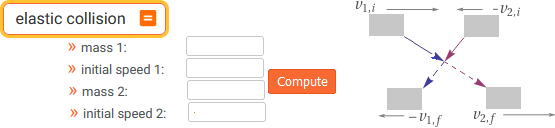
elastic collision
 | 7500 ohm resistor | |
| resistore: apparecchio che esercita una resistenza al passaggio di corrente, determinando una caduta di tensione | ||
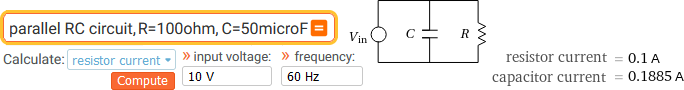
parallel RC circuit, R=100ohm, C=50microF
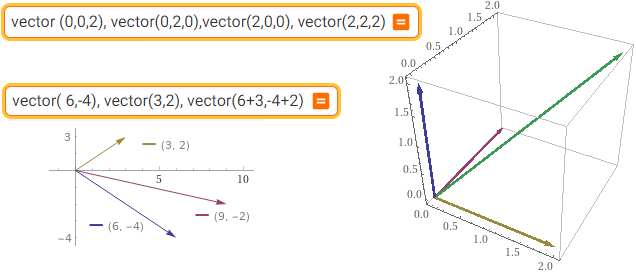
vector( 6,-4), vector(3,2), vector(6+3,-4+2) | vector (0,0,2), vector (0,2,0), vector (2,0,0), vector (2,2,2)
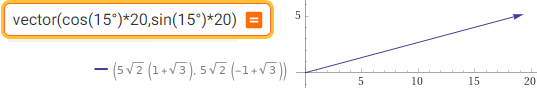 | vector(cos(15°)*20,sin(15°)*20) |
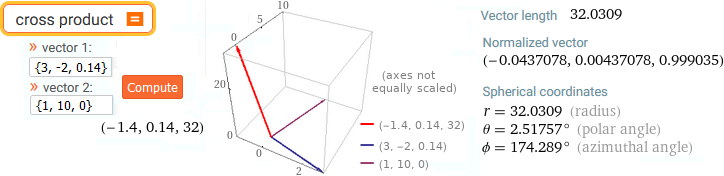
cross product vedi/see "vettori"
(2,0,4)x(1,3,1) | (2,0,4)+(1,3,1) | (2,0,4).(1,3,1) | || (2,0,4) ||
(-12, 2, 6) {3, 3, 5} 6 2*sqrt(5)
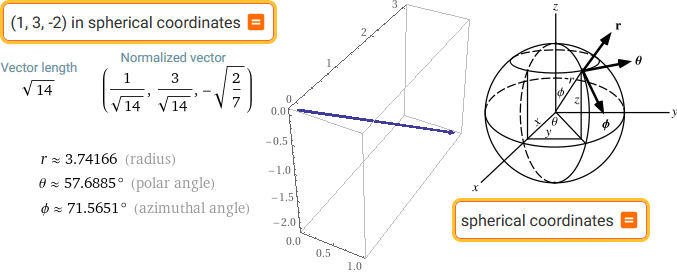
(1,3,-2) in spherical coordinates | spherical coordinates
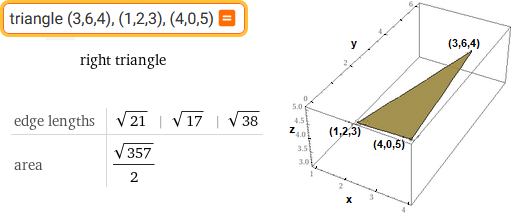
triangle (3,6,4),(1,2,3),(4,0,5)
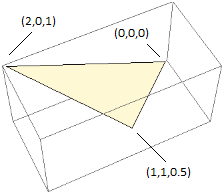 | triangle {(0, 0, 0), (1, 1, 1/2), (2, 0, 1)} from (1,2,3) |
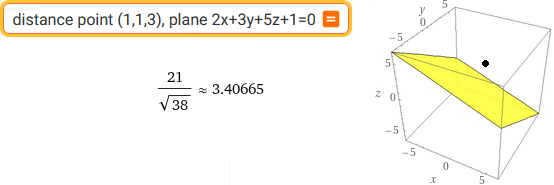
distance point (1,1,3), plane 2x+3y+5z+1=0
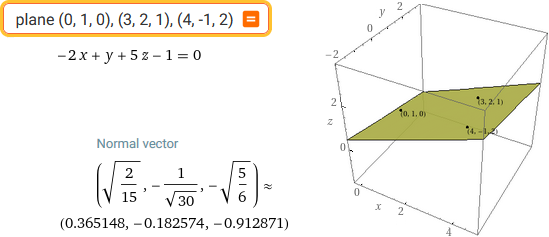
plane (0,1,0), (3,2,1), (4,-1,2)

field of view
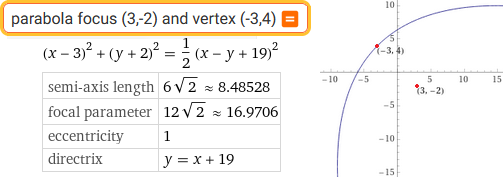
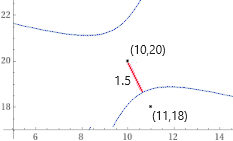 | parabola focus (3,-2) and vertex (-3,4) ellipse, foci (0,-2) and (0,2), semimajor axis 3 ellipse, semiaxes 2, 5, center (3,0) hyperbola, foci (0,-2) and (0,2), semimajor axis 1 ← hyperbola center (10, 20), focus (11, 18), semimajor axis length = 1.5 ... |
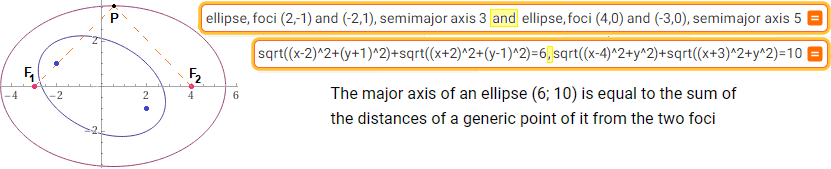
ellipse, foci (2,-1) and (-2,1), semimajor axis 3 and ellipse, foci (4,0) and (-3,0), semimajor axis 5
sqrt((x-2)^2+(y+1)^2)+sqrt((x+2)^2+(y-1)^2)=6, sqrt((x-4)^2+y^2)+sqrt((x+3)^2+y^2)=10

x = 4 + 2·cos(t), y = 3 + 5·sin(t) vs (x-4)²/2² + (y-3)²/5² = 1

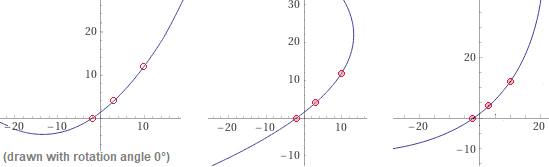
parabola points (-2,0), (3,4), (10,12) | parabola ... , rotation angle 90 | parabola ... , rotation angle 45
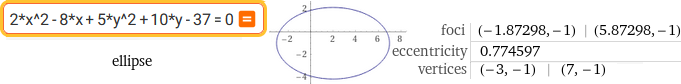 2*x^2-8*x+5*y^2+10*y-37 = 0  (x-2*y)^2+3*y-4=0 | 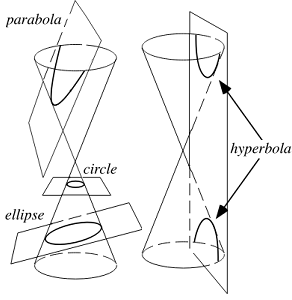 | |
|

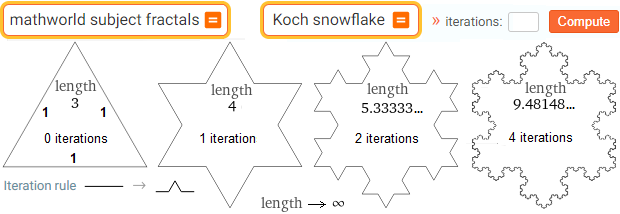
mathworld subject fractals | Koch snowflake vedi/see anim[u]...
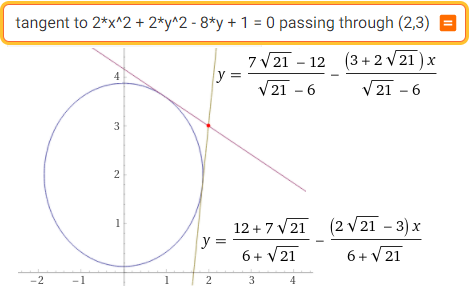
tangent to 2*x^2+2*y^2-8*y+1=0 passing through (2,3)
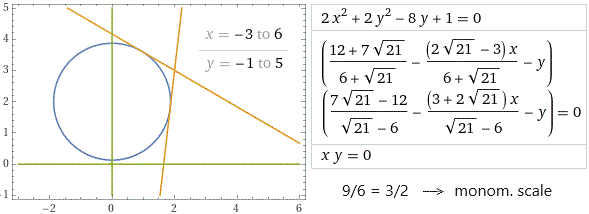
plot 2*x^2+2*y^2-8*y+1=0, ((12+7 sqrt(21))/(6+sqrt(21))-((2 sqrt(21)-3)x)/(6+sqrt(21))-y)*((7 sqrt(21)-12)/(sqrt(21)-6)-((3+2 sqrt(21))x)/(sqrt(21)-6)-y)=0, x*y=0, x=-3..6, y=-1..5
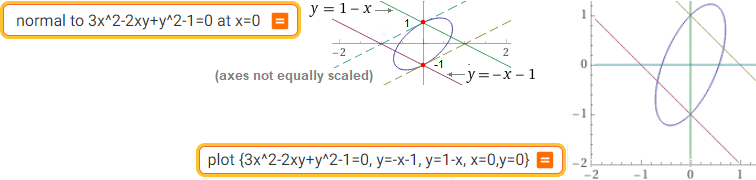
normal to 3x^2-2xy+y^2-1=0 at x=0 | plot {3x^2-2xy+y^2-1=0, y=-x-1, y=1-x, x=0, y=0}
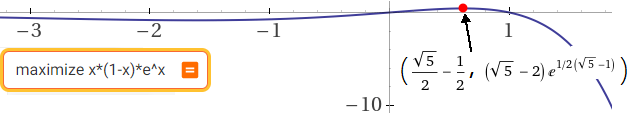
maximize x*(1-x)*e^x or: max ...
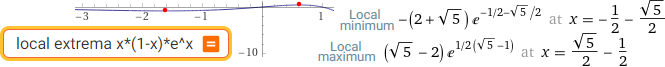
local extrema x*(1-x)*e^x

stationary points (x^2-x-1)^3
| inflection points (x^2-x-1)^3 | 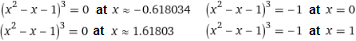 |
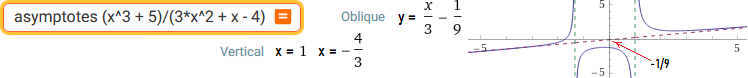
asymptotes (x^3 + 5)/(3*x^2 + x - 4)
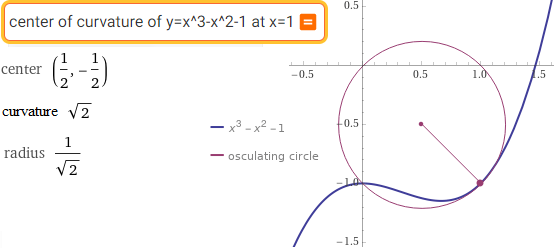
center of curvature of y=x^3-x^2-1 at x=1
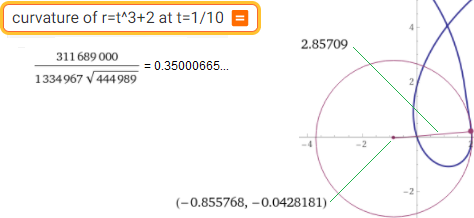
curvature of r=t^3+2 at t=1/10

arc length of y=sin(x) from x=0 to PI
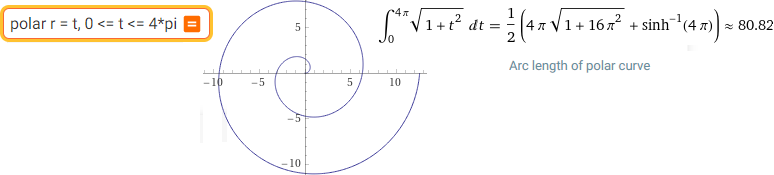
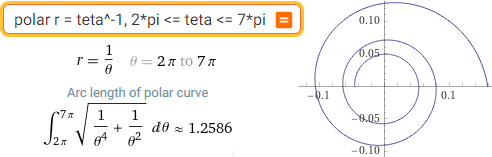
polar r = t, 0 <= t <= 4*pi | polar r = teta^-1, 2*pi <= teta <= 7*pi
| spiral |  | ... |
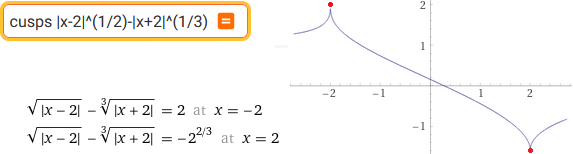
cusps |x-2|^(1/2)-|x+2|^(1/3)
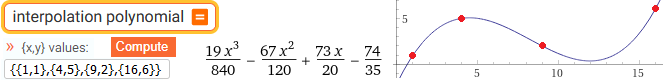
interpolation polynomial
 Bezier curve
 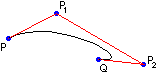 vedi
vedi
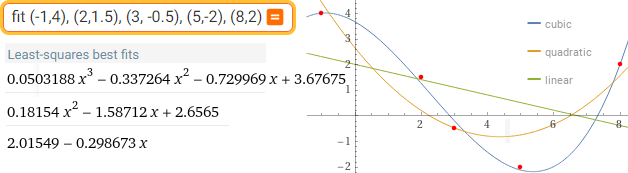
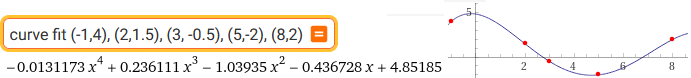
cubic fit (-1,4), (2,1.5), (3, -0.5), (5,-2), (8,2)
In alternativa posso usare "cubic fit [=]" e introdurre { (-1,4), (2,1.5), (3, -0.5), (5,-2), (8,2) } in "{x,y} values"
Alternatively I can use "cubic fit [=]" and introduce { (-1,4), (2,1.5), (3, -0.5), (5, -2), (8,2) } in "{x y} values"
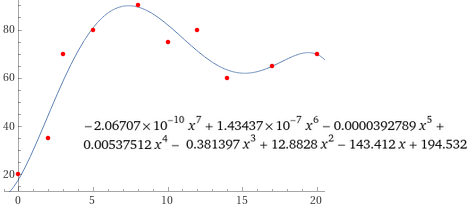
fit (0,20),(2,35),(3,70),(5,80),(8,90),(10,75),(12,80),(14,60),(17,65),(20,70) polynomial of degree 5
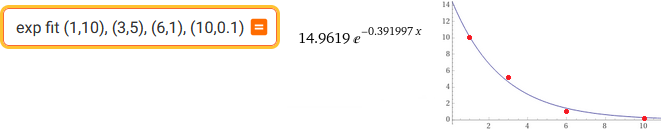
exp fit (1,10), (3,5), (6,1), (10,0.1)

log fit (12,0),(16,3),(17,12.5),(22,23),(57,42),(135,56),(180,63),(410,90)

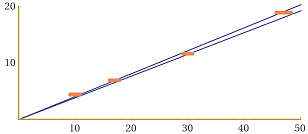
linear fit or linear fit (47,21.9), (30,11.8), (17,5.9), (55, 29.2)
Ottengo la funzione e il grafico rappresentati sotto a sinistra:
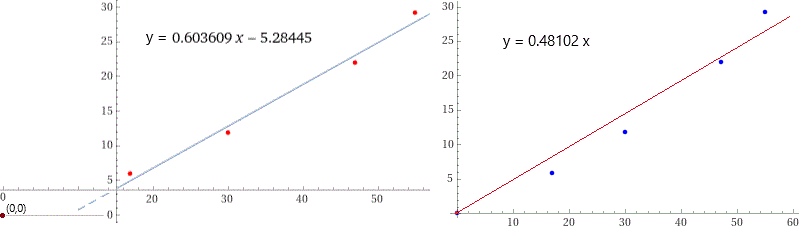
Vedi qui come ottenere la funzione lineare vincolata a passare per un punto (sopra a destra quella relativa
agli stessi dati ma vincolata a passare per (0,0), ipotizzando che il fenomeno studiato sia di diretta
proporzionalità) e come analizzare dati dotati di precisione, per ottenere rappresentazioni come la seguente:
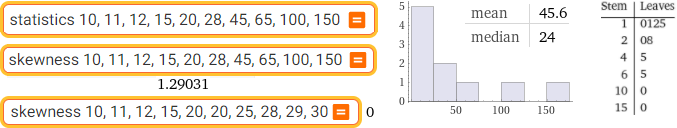
statistics 10, 11, 12, 15, 20, 28, 45, 65, 100, 150 | skewness 10, 11, ... skewness: coefficient of asymmetry
Battiti cardiaci (numero dei battito al minuto) registrati tra le studentesse di un corso universitario
Heartbeats (number of beats per minute) recorded among female students of a university course:
{96,62,78,82,100,68,96,78,88,62,80,84,61,64,94,60,72,58,88,66,84,62,66,80,78,68,72,82,76,87,90,78,68,86,76}
median mean variance quartiles IQR
|
Posso esaminare i dati anche col comando statistics. Se i dati fossero meno (34) potrei tracciare anche il box-plot → I can also examine the data with the statistics command. If the data were less (34) I could also plot the box plot → Se i dati sono molti posso ricorrere allo script "box-plot" If there is a lot of data I can use ... |
 |
 |
MovingAverage[ {7.6,6.4,8.4,6,7.6,6.5,6.3,5.4,6.3,5.2,4.8,2.9,7.4,6.9,5.5,7.6,9.9,12.0,9.4,5.1,3}, 3] |
Per approndimenti tecnici e operativi / For technical and operational insights vedi/see "medie mobili".

data: x1, ..., xN
population sd = the root mean square = sqrt of ( ((x1-mean)^2+...+(xN-mean)^2) / N )
(sample) sd = sqrt of ( ((x1-mean)^2+...+(xN-mean)^2) / (N-1) )
standard deviation of the mean = (sample sd) / sqrt(N) (or [*])
sd (7.3, 7.1, 7.2, 6.9, 7.2, 7.3, 7.4, 6.8, 7.0, 7.1, 6.9) → 0.192117
population sd (7.3, 7.1, 7.2, 6.9, 7.2, 7.3, 7.4, 6.8, 7.0, 7.1, 6.9) → 0.183177
length of (7.3, 7.1, 7.2, 6.9, 7.2, 7.3, 7.4, 6.8, 7.0, 7.1, 6.9) → 11
0.192117/ sqrt(11) → 0.0579255...
[*] more briefly:
standard error of the mean (7.3,7.1,7.2,6.9,7.2,7.3,7.4, 6.8,7.0,7.1,6.9) → 0.0579256

formula confidence interval
Per più numerosi dati puoi usare questa "calcolatrice" / For larger amounts of data you can use this "calculator" vedi/see "calcolatrice2"
Per regressione lineare e quadratica, correlazione e test χ² / For linear and quadratic regression, correlation and χ² test vedi/see.

chi-squared distribution
gaussian distribution | probability gaussian | exponential distribution | Poisson distribution | Poisson distribution cdf
plot y=exp(-((x-m)/s)^2/2)/(sqrt(2*PI)*s), for s=0.03,0.02,0.01,m=0.5
plot y=exp(-((x-m)/s)^2/2)/(sqrt(2*PI)*s), for s=0.03,0.02,0.01,m=0.5 from x=0.44 to 0.56, 0 < y < 45
Note. There are few phenomena that have a Gaussian trend (for example, as we have seen above, the heights of adults of a certain population have this but their weights do not). If a certain quantity N of measurements of a certain size is repeatedly made, it is not the various groups of measurements that tend to have a Gaussian trend but it is the N average values gradually obtained that tend to have a Gaussian distribution. This is the reason why I can associate the average value of a series of measurements with a precision that can be determined with the "standard error of the mean".
| A very large aggregate of people is made up of 36% of men and 64% of children of the same age. The men's heights have an average value of 174.2 cm and a standard deviation of 7.1 cm. For children the values are 132.4 and 5.6. The trend of both distributions is Gaussian. How is the distribution of their union? | 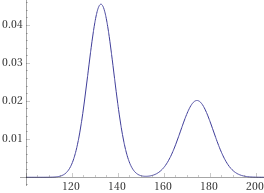 |
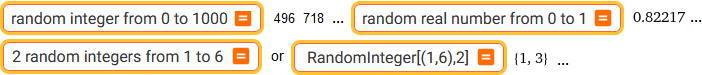
random integer form 0 to 1000 | ... | RandomInteger[(1,6),2] vedi/see gli script "n.casuali" e le note a "n.casuali reali"
RandomReal[(1,5)], RandomReal[(1,5)], RandomReal[(1,5)], RandomReal[(1,5)] {1.01912, 4.86584, 3.12758, 1.60412}
For gaussian, esponential, Poisson distributions vedi/see "generare distribuzioni"

random permutation 12 elements | 12 random integers from 1 to 12

C(12,n) where n = 0,1,2,3,4,5,6,7,8,9,10,11,12
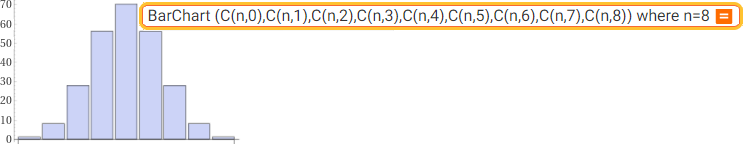
BarChart (C(n,0),C(n,1),C(n,2),C(n,3),C(n,4),C(n,5),C(n,6),C(n,7),C(n,8)) where n=8
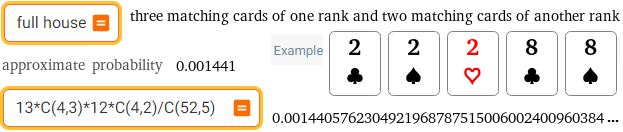
full house | 13*C(4,3)*12*C(4,2)/C(52,5)
probabilities poker | mathworld subject card games
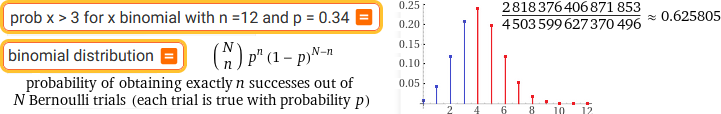
prob x > 3 for x binomial with n =12 and p = 0.34 or [*] | binomial distribution
prob X<16 for X geometric with p=0.1 | geometric distribution | uniform distribution
[*] Pr( x > 3) where x is binomial with n =12 and p = 0.34 or
for k=4 to 12 sum( binomial(12,k)*0.34^k*(1-0.34)^(12-k) )
0.62580527579389019981824
The multinomial distribution is a generalization of the binomial distribution.
If A, B, C, … have probability pA, pB, pC, … (pA+pB+pC+…=1), the probability that the outcomes are nA, nB, nC, … is
(nA +nB + nC + ...)! / ( nA! * nB! * nC! * ...) * pA^nA * pB^nB * pC^nB * ...
The probability that, from a box in which 20 000 red sticks, 50 000 blue sticks and 30 000 yellow sticks (all of equal size and weight) are placed, 2 red and 1 yellow sticks are extracted:
(3)! / ( (2)!*(0)!*(1)! ) * (2/10)^2*(5/10)^0*(3/10)^1 0.036 9/250 (easy handmade calculation: 6/2*4/100*1*3/10)
(the number of sticks extracted is much less than the total number of sticks, so we can evaluate the probabilities as if there were the reinsertion of the extracted sticks; the rigorous calculation: 20000/100000*19999/99999*30000/99998*3 → 0.03599927... ≈ 0.036)

linear independence of (2, 3, -4), (-1, -2, 5), (4, k, 6)

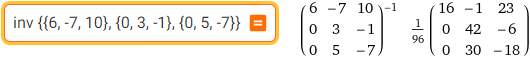
inv {{6,-7,10),{0,3,-1},{0,5,-7}}
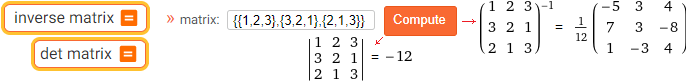

inverse matrix | det matrix | determinant | matrix
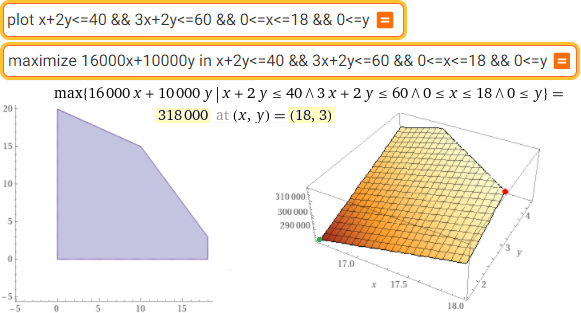
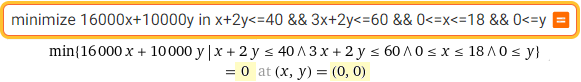
plot x+2y<=40 && 3x+2y<=60 && 0<=x<=18 && 0<=y
maximize 16000x+10000y in x+2y<=40 && 3x+2y<=60 && 0<=x<=18 && 0<=y or: max ...
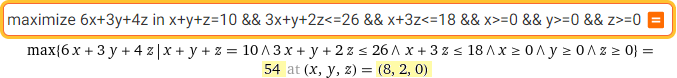
maximize 6x+3y+4z in x+y+z=10 && 3x+y+2z<=26 && x+3z<=18 && x>=0 && y>=0 && z>=0
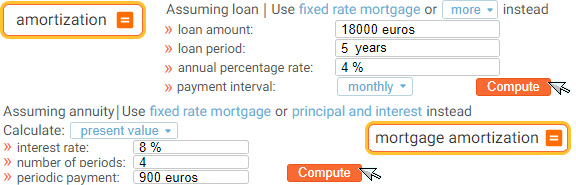
amortization | mortgage amortization | mortgage
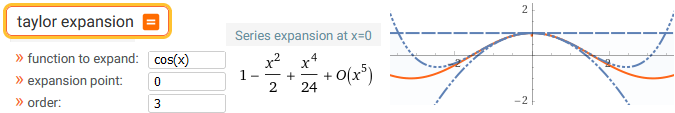
taylor expansion

power series of 1/(2+x) around 1
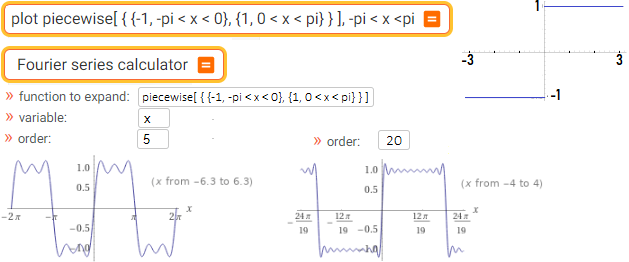
plot piecewise[ { {-1, -pi < x < 0}, {1, 0< x < pi} } ], -pi < x < pi | Fourier series calculator

Hessian matrix x*y^2
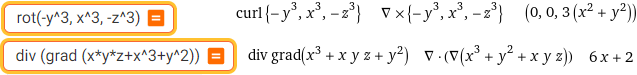
rot(-y^3, x^3, -z^3) | div (grad (x*y*z+x^3+y^2))
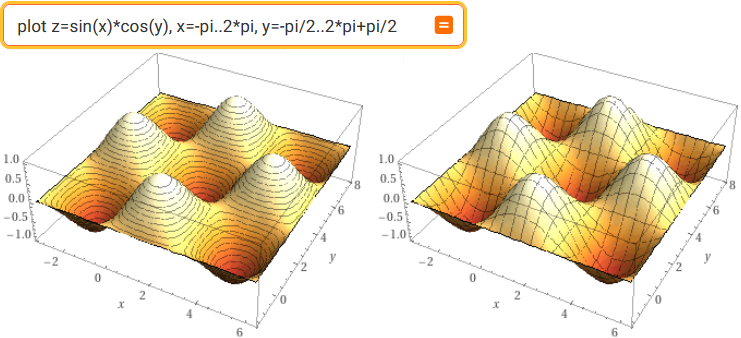
plot z=sin(x)*cos(y), x=-pi..2*pi, y=-pi/2..2*pi+pi/2
plot z=sin(x)*cos(y), x=-pi..2*pi, y=-pi/2..2*pi+pi/2 view from (10,10,-2)
I grafici 3D con Desmos
| plot z=sin(x)*cos(x), x=-pi..2*pi,y=-2..2 | 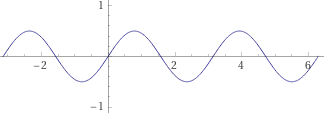 |
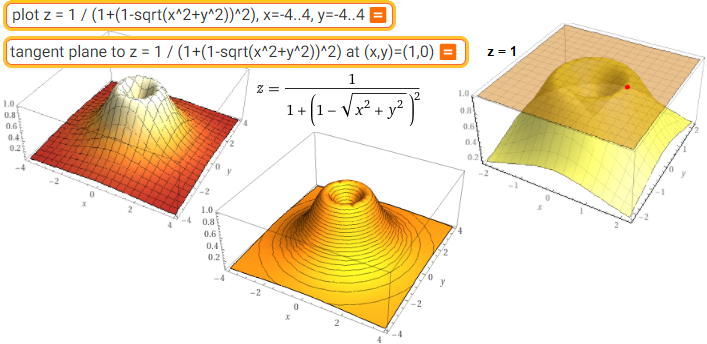
plot z = 1 / (1+(1-sqrt(x^2+y^2))^2), x=-4..4, y=-4..4 | tangent plane to z=1/(1+(1-sqrt(x^2+y^2))^2) at (x,y)=(1,0)
 | plot z = 1 / (1+(1-sqrt(x^2+y^2))^2), x=-4..4, y=-4..4 view from (10,10,30) |
|
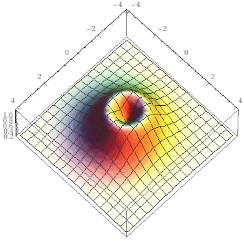
level curves 1 / (1+(1-sqrt(x^2+y^2))^2) level curves 1 / (1+(1-sqrt(x^2+y^2))^2), x=-2..2, y=-2..2 | 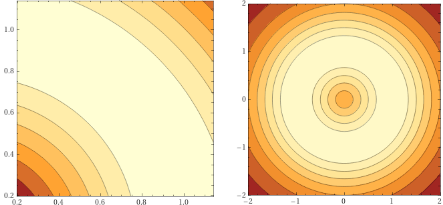 |
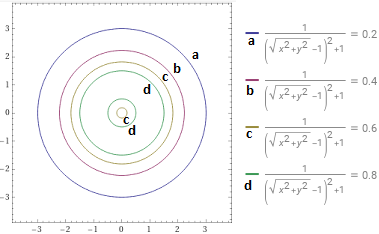
1/(1+(1-sqrt(x^2+y^2))^2)=0.2,1/(1+(1-sqrt(x^2+y^2))^2)=0.4,1/(1+(1-sqrt(x^2+y^2))^2)=0.6,1/(1+(1-sqrt(x^2+y^2))^2)=0.8
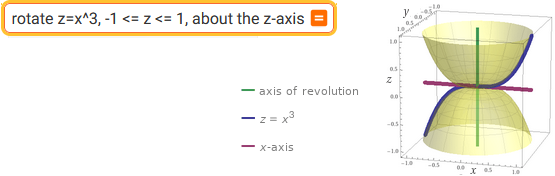
rotate z=x^3, -1 <= z <= 1, about the z-axis
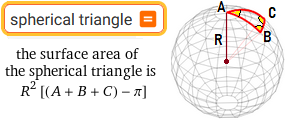 | spherical triangle Passeggiando sulle sfere Walking on the spheres vedi/see | |
 | trigonometry | spherical trigonometry |
| plot x^2+y^2+z^2 = 25 | 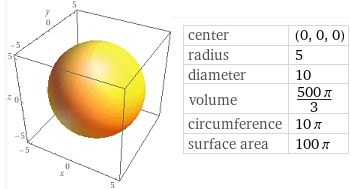 |
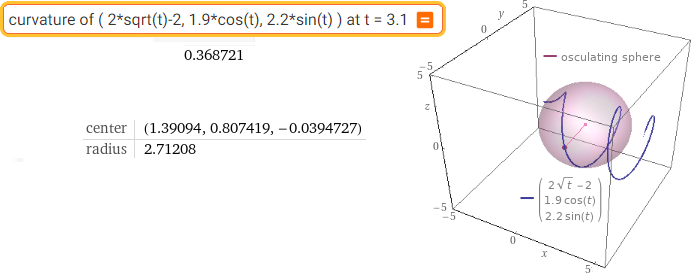
curvature of ( 2*sqrt(t)-2, 1.9*cos(t), 2.2*sin(t) ) at t = 3.1
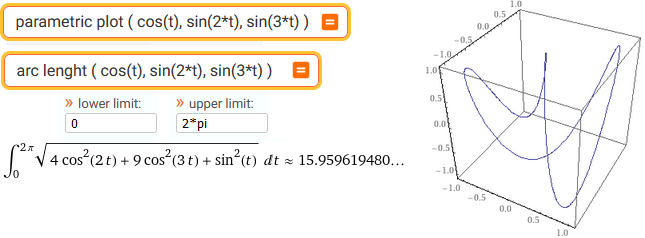
parametric plot ( cos(t), sin(2*t), sin(3*t) ) | length ( cos(t), sin(2*t), sin(3*t) )
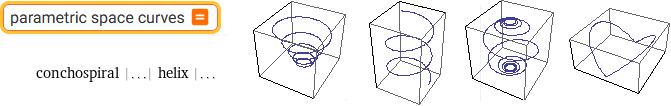
parametric space curves
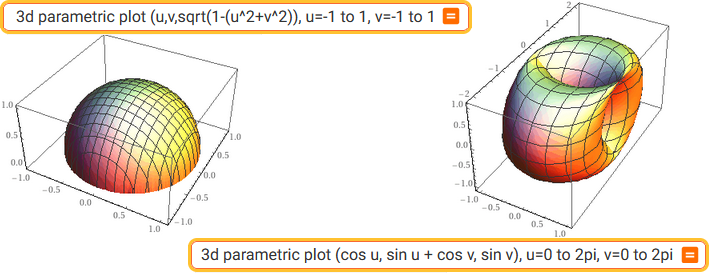
3d parametric plot (u,v,sqrt(1-(u^2+v^2)), u=-1 to 1, v=-1 to 1 | 3d parametric plot (cos u, sin u + cos v, sin v), u=0 to 2pi, v=0 to 2pi
| mathworld subject platonic solids regular polyhedra | 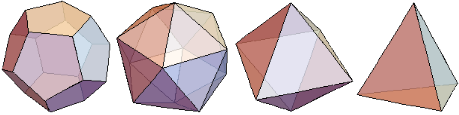 |


cone, radius=4, height=6 | cone, volume v, height 7
| truncated cylinder |  |
solid of revolution calculator (truncated cone with hole)
center (0,0,0), edge length 1, edges parallel to the axes
cube view from (2,1,1) | cube view from (2,0,2) | cube view from (100,100,100)
pyramid view from (2,2,0) | pyramid view from (0,-0.045,0.5) | pyramid view from (0,-0.045,0.49)
prism view from .. | cuboid view from .. | parallelepiped view from ..
cone view from .. | conical frustum view from ..
| cube side 1, cube side 2 |  |
| cuboid 4,3,5 view from (4,2,7) pyramid 3 view from (4,2,3) pyramid 4 view from (4,2,3) |  |
| vanishing point punto all'infinito punto di fuga |  |
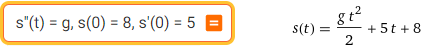
s''(t) = g, s(0) = 8, s'(0) = 5
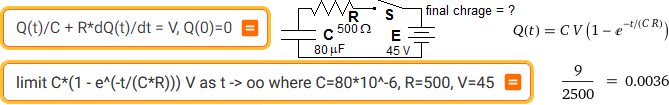
Q(t)/C + R*dQ(t)/dt = V, Q(0)=0 | limit C*(1 - e^(-t/(C*R))) V as t -> oo where C=80*10^-6, R=500, V=45


rot(-omega*y, omega*x, 0) | jacobian { r * cos(k*t), r * sin(k*t) } with respect to (r, t)
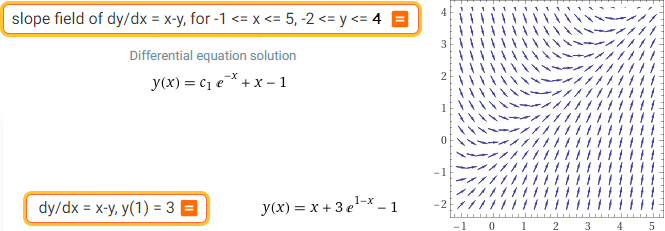
slope field of dy/dx = x-y, for -1 <= x <= 5, -2 <= y <= 4 | dy/dx = x-y, y(1) = 3
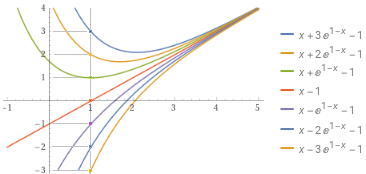
plot x+3*e^(1-x)-1, x+2*e^(1-x)-1, x+e^(1-x)-1, x-1, x-e^(1-x)-1, x-2*e^(1-x)-1, x-3*e^(1-x)-1 for -1<x<5, -3<y<4
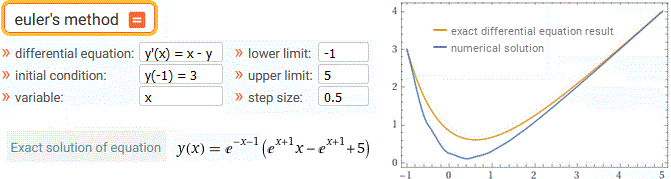
euler's method
plot abs(abs(x-1)-2)-1, -5 < x < 7, -2 < y < 3, color blue [ F'(x) = | |x - 1| - 2 | - 1, F(0) = 0, F → red graph]
plot piecewise[{ {-(x+2)^2/2+1,x<= -1}, { x^2/2,-1<x<1}, { -(x-2)^2/2+1,1<x<3}, { (x-4)^2/2, x>3} }], x = -5..7, y = -2..3, color red
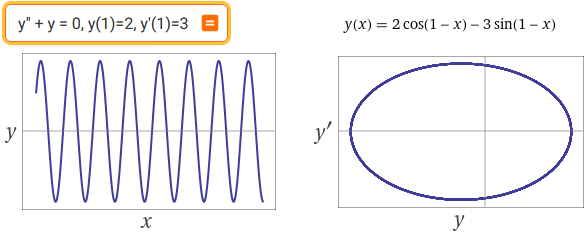
y'' + y = 0, y(1)=2, y'(1)=3
y' = -x*y^2/(1+x^2*y)
y' = -x*y^2/(1+x^2*y), y(0) = 2 ... y' = -x*y^2/(1+x^2*y), y(-2) = -1
plot (-1+sqrt(1+4 x^2))/x^2, (-1+sqrt(1+2 x^2))/x^2, (-1+sqrt(1-2 x^2))/x^2, -(1+sqrt(1+2 x^2))/x^2, (-1+sqrt(1-x^2))/x^2 for -3 < x < 3

integrate 1 dx dy, x=-1..1, y=-1..1 | sqrt(integrate 1/(2*pi)*exp(-(x^2+y^2)/2) dx dy, x=-1..1, y=-1..1)
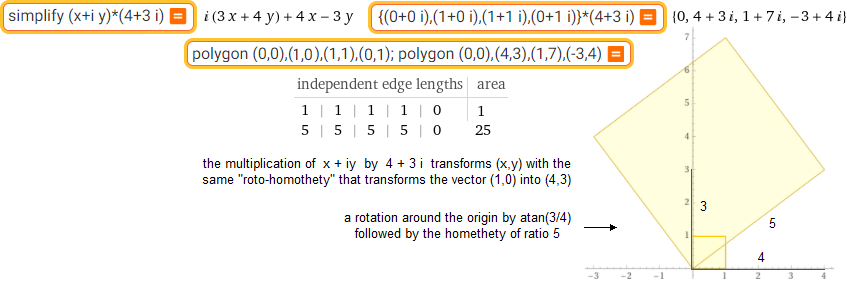
simplify (x+ iy)*(4+3 i) | {(0+0i),(1+0 i),(1+1i),(0+1 i)}*(4+3 i)
polygon (0,0),(1,0),(1,1),(0,1); polygon (0,0),(4,3),(1,7),(-3,4)
The circle cos(t)+i*sin(t) transfromed by z → z²+z+1 (z = x+i*y)
(cos(t)+i*sin(t))^2 + cos(t)+i*sin(t) + 1
I have: cos(t) + cos(2 t) + i sin(t) (2 cos(t) + 1) + 1
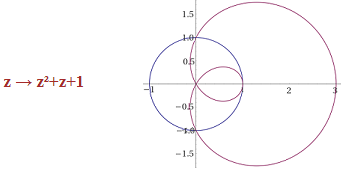
parametric plot (cos(t), sin(t)), parametric plot ( sin(t)-cos(2*t)+1, (2*sin(t)+1)*cos(t) )

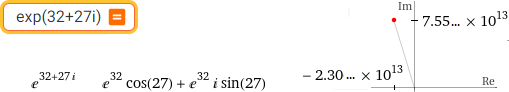
(3+2i)* | exp(32+27i)
| (x + iy)^2 + (x + iy) |  |
|
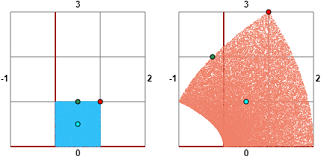
(x, y) → (x^2 + x - y^2, 2 x y + y) |
 |
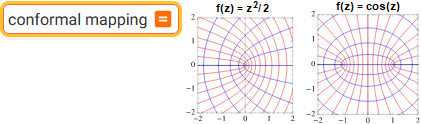 | conformal mapping vedi/see: mathworld.wolfram.com |

factor z^9-z^3 | solve z^9=z^3 for z complex
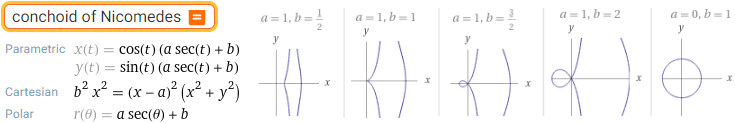
conchoid of Nicomedes
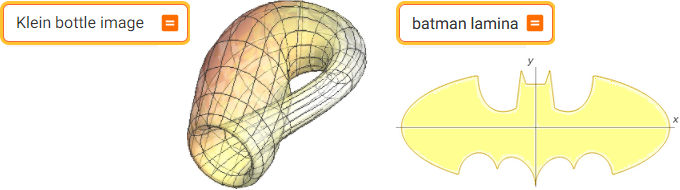
Klein bottle image | batman lamina
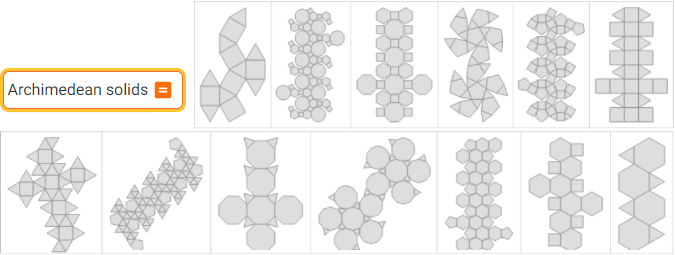
Archimedean solids

mathworld subject complexity of algorithms

rule

mathworld subject notation

mathworld subject terminology
Puoi esaminare esempi sui vari temi matematici:

examples mathematics
Puoi esaminare esempi "a caso":

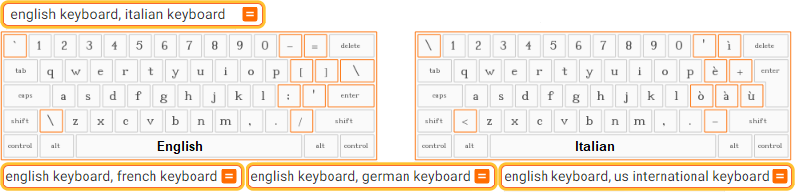
english keyboard, italian keyboard | french | german | us international
Puoi ridimensionare le immagini e salvarle in diversi formati
You can resize images and save them in different formats

pie chart(1,2,3)
In "Paint" o in un'altra applicazione puoi modificare l'immagine / In "Paint" or in another application you can edit the image
Puoi copiare formule da un documento e incollarle in WolframAlpha - quasi sempre le accetta
You can copy formulas from a document and paste them into WolframAlpha - it almost always accepts them
Es. Ho: √(z²+5) = y+3 Per ottenere quanto segue posso scrivere in WolframAlpha solve for z, poi copiare e incollare in mezzo √(z²+5) = y+3
Ex. I have: √(z²+5) = y+3 To get the following I can write in WolframAlpha solve for z, then copy and paste in the middle √(z²+5) = y+3
