
Si mettono i dati di cui fare le medie mobili nella prima finestra (finestra di input), si clicca [MM]; si ottengono le medie mobili nella seconda finestra (di output]. Se si vuole ripetere la procedura si clicca [Copy] e le medie mobili ottenute vengono copiate nella prima finestra, si clicca [MM] e si ottengono nella seconda finestra le nuove medie mobili, e così via, se si vuole continuare. Nella terza finestra viene ricordato quanto via via fatto. Gli esiti vengono calcolati con (circa) 10 cifre dopo il ".". Se i dati sono dell'ordine delle centinaia si può ridurre il numero delle cifre (ad es. mettere [2 ]). Se clicco [C] vengono pulite le finestre di input e di ouput.
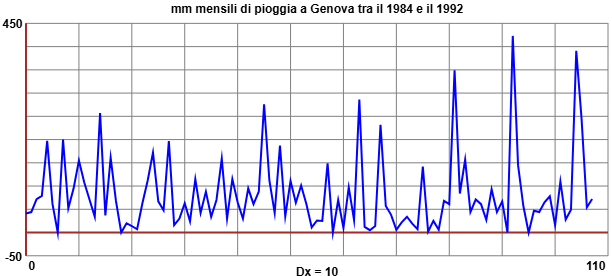
First example. If I click rain I have the data "mm of monthly rainfall in Genoa in the period 1984-92":
| mm mensili di pioggia a Genova nel periodo 1984-92 mm of rain per month in Genoa in the period 1984-92 41, 44, 72, 79, 197, 62, 0, 200, 52, 95, 155, 108, 71, 34, 257, 37, 161, 68, 0, 20, 14, 7, 63, 112, 172, 67, 48, 197, 16, 30, 63, 24, 115, 42, 88, 34, 70, 159, 30, 115, 65, 30, 95, 61, 88, 276, 112, 42, 187, 35, 111, 64, 101, 61, 11, 26, 25, 149, 0, 70, 10, 97, 27, 286, 12, 5, 14, 232, 57, 38, 6, 22, 34, 19, 7, 142, 2, 25, 6, 68, 61, 349, 84, 157, 44, 71, 61, 27, 93, 44, 67, 0, 423, 145, 57, 0, 47, 44, 65, 78, 16, 110, 28, 49, 391, 245, 54, 72 |
Their representation width this script, where the vertical segments are 12 (months) apart:
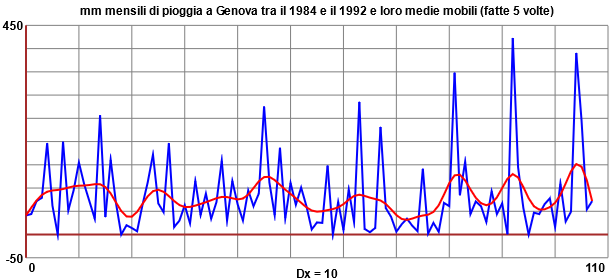
I want to study the presence of seasonal factors. I put the data in the first box. In the second I obtain:
In the third box I obtain: min1,max1: 0, 423 min2,max2: 10.333333333, 230 n=108
Vi sono numeri dell'ordine delle centinaia. Posso ridurre il numero delle cifre a 2. Ripeto la procedura più volte:

Their representation width this script:
Second example. Below are the growth rates (cm per year) of a group of North American males around 1980. We graphically represent the trend using appropriate moving averages and estimate how much the growth rate varies from the onset of puberty (minimum point, around at 10 years) to the peak value which it reaches shortly after (around 14 years). In the case of females the trend is similar, but anticipated by more than a year.
| Groth rates (cm per year) at 2, 2.5, 3, 3.5, ..., 17, 17.5 years of age Tassi di crescita (cm all'anno) all'età di 2, 2.5, 3, 3.5, ..., 17, 17.5 anni 11.6, 8.8, 7.6, 6.4, 8.4, 6.5, 6, 6.1, 7.6, 6.5, 6.3, 6.5, 5.4, 6.3, 5.2, 4.9, 4.8, 2.9, 7.4, 6.9, 5.5, 5.5, 7.6, 10.3, 9.9, 12.0, 9.4, 5.1, 5.3, 4.4, 3.7, 3.0 |
Their representation width this script:


We can estimate that, on average, the growth velocity during puberty varies from about 5 cm/year to about 10 cm/year. The "pubertal peak" (in boys around 14 years of age, in girls around 12 years of age) is regulated by particular hormones, testosterone in boys, estrogen in girls.
Third example. Wholesale price in €/kg over 42 days in autumn 2010 of the copper:
| 6.877, 6.872, 6.906, 6.888, 6.810, 6.962, 6.958, 7.002, 6.942, 6.909, 6.985, 6.968, 6.931, 6.978, 6.942, 7.045, 7.077, 7.025, 6.998, 6.913, 6.970, 6.969, 6.975, 6.957, 7.174, 7.236, 7.358, 7.358, 7.551, 7.377, 7.322, 7.244, 7.037, 7.147, 7.152, 7.163, 7.031, 7.033, 7.201, 7.240, 7.290, 7.320 |
| 6.877, 6.88, 6.88, 6.88, 6.9, 6.92, 6.95, 6.96, 6.96, 6.95, 6.95, 6.96, 6.96, 6.97, 6.99, 7.01, 7.02, 7.02, 6.99, 6.97, 6.96, 6.97, 7, 7.06, 7.14, 7.23, 7.32, 7.38, 7.4, 7.37, 7.31, 7.23, 7.17, 7.14, 7.13, 7.11, 7.11, 7.12, 7.17, 7.22, 7.28, 7.320 |
The graph was plotted with this script.

Wholesale price in €/kg of of brass and zinc (and the moving mean). Note the similarities and differences between the three trends. See this and this scripts.
| 4.48, 4.48, 4.48, 4.51, 4.51, 4.51, 4.51, 4.51, 4.54, 4.54, 4.54, 4.57, 4.57, 4.54, 4.54, 4.57, 4.57, 4.62, 4.62, 4.57, 4.57, 4.55, 4.55, 4.55, 4.60, 4.63, 4.73, 4.73, 4.80, 4.80, 4.75, 4.75, 4.65, 4.65, 4.65, 4.65, 4.60, 4.60, 4.63, 4.63, 4.68, 4.68 |
| 4.48, 4.48, 4.49, 4.5, 4.51, 4.51, 4.51, 4.52, 4.53, 4.54, 4.55, 4.56, 4.56, 4.55, 4.55, 4.57, 4.58, 4.6, 4.6, 4.58, 4.57, 4.56, 4.56, 4.57, 4.6, 4.65, 4.7, 4.74, 4.77, 4.78, 4.76, 4.72, 4.68, 4.66, 4.64, 4.63, 4.62, 4.62, 4.63, 4.64, 4.66, 4.68 |

| 1.61, 1.64, 1.66, 1.65, 1.61, 1.65, 1.67, 1.71, 1.70, 1.69, 1.70, 1.71, 1.72, 1.75, 1.79, 1.82, 1.84, 1.82, 1.78, 1.73, 1.76, 1.73, 1.73, 1.74, 1.76, 1.77, 1.80, 1.83, 1.84, 1.78, 1.69, 1.66, 1.55, 1.57, 1.56, 1.56, 1.54, 1.55, 1.59, 1.60, 1.62, 1.61 |
| 1.61, 1.628, 1.639, 1.641, 1.645, 1.654, 1.671, 1.686, 1.695, 1.699, 1.704, 1.715, 1.733, 1.757, 1.784, 1.805, 1.811, 1.802, 1.782, 1.762, 1.747, 1.741, 1.74, 1.747, 1.76, 1.779, 1.797, 1.806, 1.794, 1.758, 1.705, 1.649, 1.604, 1.576, 1.562, 1.556, 1.558, 1.566, 1.581, 1.596, 1.605, 1.61 |

Quarto esempio. Casi di Covid in quasi due mesi in un piccolo stato europeo nel 2020:
| 213, 526, 338, 671, 429, 1182, 686, 837, 641, 783, 639, 785, 760, 613, 798, 617, 515, 631, 622, 492, 558, 398, 509, 421, 457, 568, 739, 706, 614, 742, 775, 722, 631, 643, 626, 734, 690, 787, 939, 891, 1093, 1432, 1308, 1741, 2116, 1975, 2010, 2397 |
| 213, 341.4074074074074, 465.03703703703695, 567.4814814814814, 687.2592592592592, 758.0370370370371, 799.2592592592592, 769.7777777777777, 746.2592592592591, 721.2222222222222, 723.4814814814814, 722.8148148148148, 719.2222222222222, 703.6666666666666, 674.3333333333334, 641.1481481481482, 609.5555555555555, 589.7037037037038, 567.6296296296297, 542.0370370370371, 507.0740740740741, 481.7037037037037, 466, 479.18518518518516, 517.8148148148148, 579.8518518518518, 636.7777777777778, 674.8888888888888, 696.9629629629629, 710.4444444444443, 714.5555555555555, 699.4444444444445, 677.2592592592592, 662.074074074074, 670.9629629629629, 699.7777777777778, 747.5925925925927, 810.2592592592595, 894.6666666666669, 1003.1111111111113, 1142.888888888889, 1310.4074074074076, 1506.925925925926, 1705.7407407407409, 1884.8518518518522, 2040.2592592592594, 2206, 2397 |
The graph was plotted with this script.
